


Earthquakes.
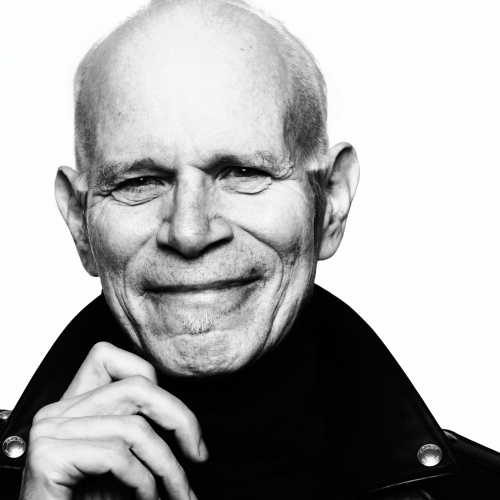
by: Jonathan Laguna
Earthquakes was an attempted to visualize earthquake data recorded by USGS (science for a changing world). Its main aim was to look into a way which data could be express primarily looking to produce an object out of it. Which had to be minimalistic and relative to the Digital Arts practice. I wanted to make roughly show data in very non-interactive and simplistic manner to emphasis on our modern necessity to be entertained and distracted.
This came from my believe that Digital Art can be too entertaining and lose people artistic experiences with interactivity regardless of the artist objective, losing significance conceptually and becoming too entertaining. Therefore the method I attempted to implement was one, which stayed way from conceptually, entertainment and symbolism yet within the Digital arts realm.
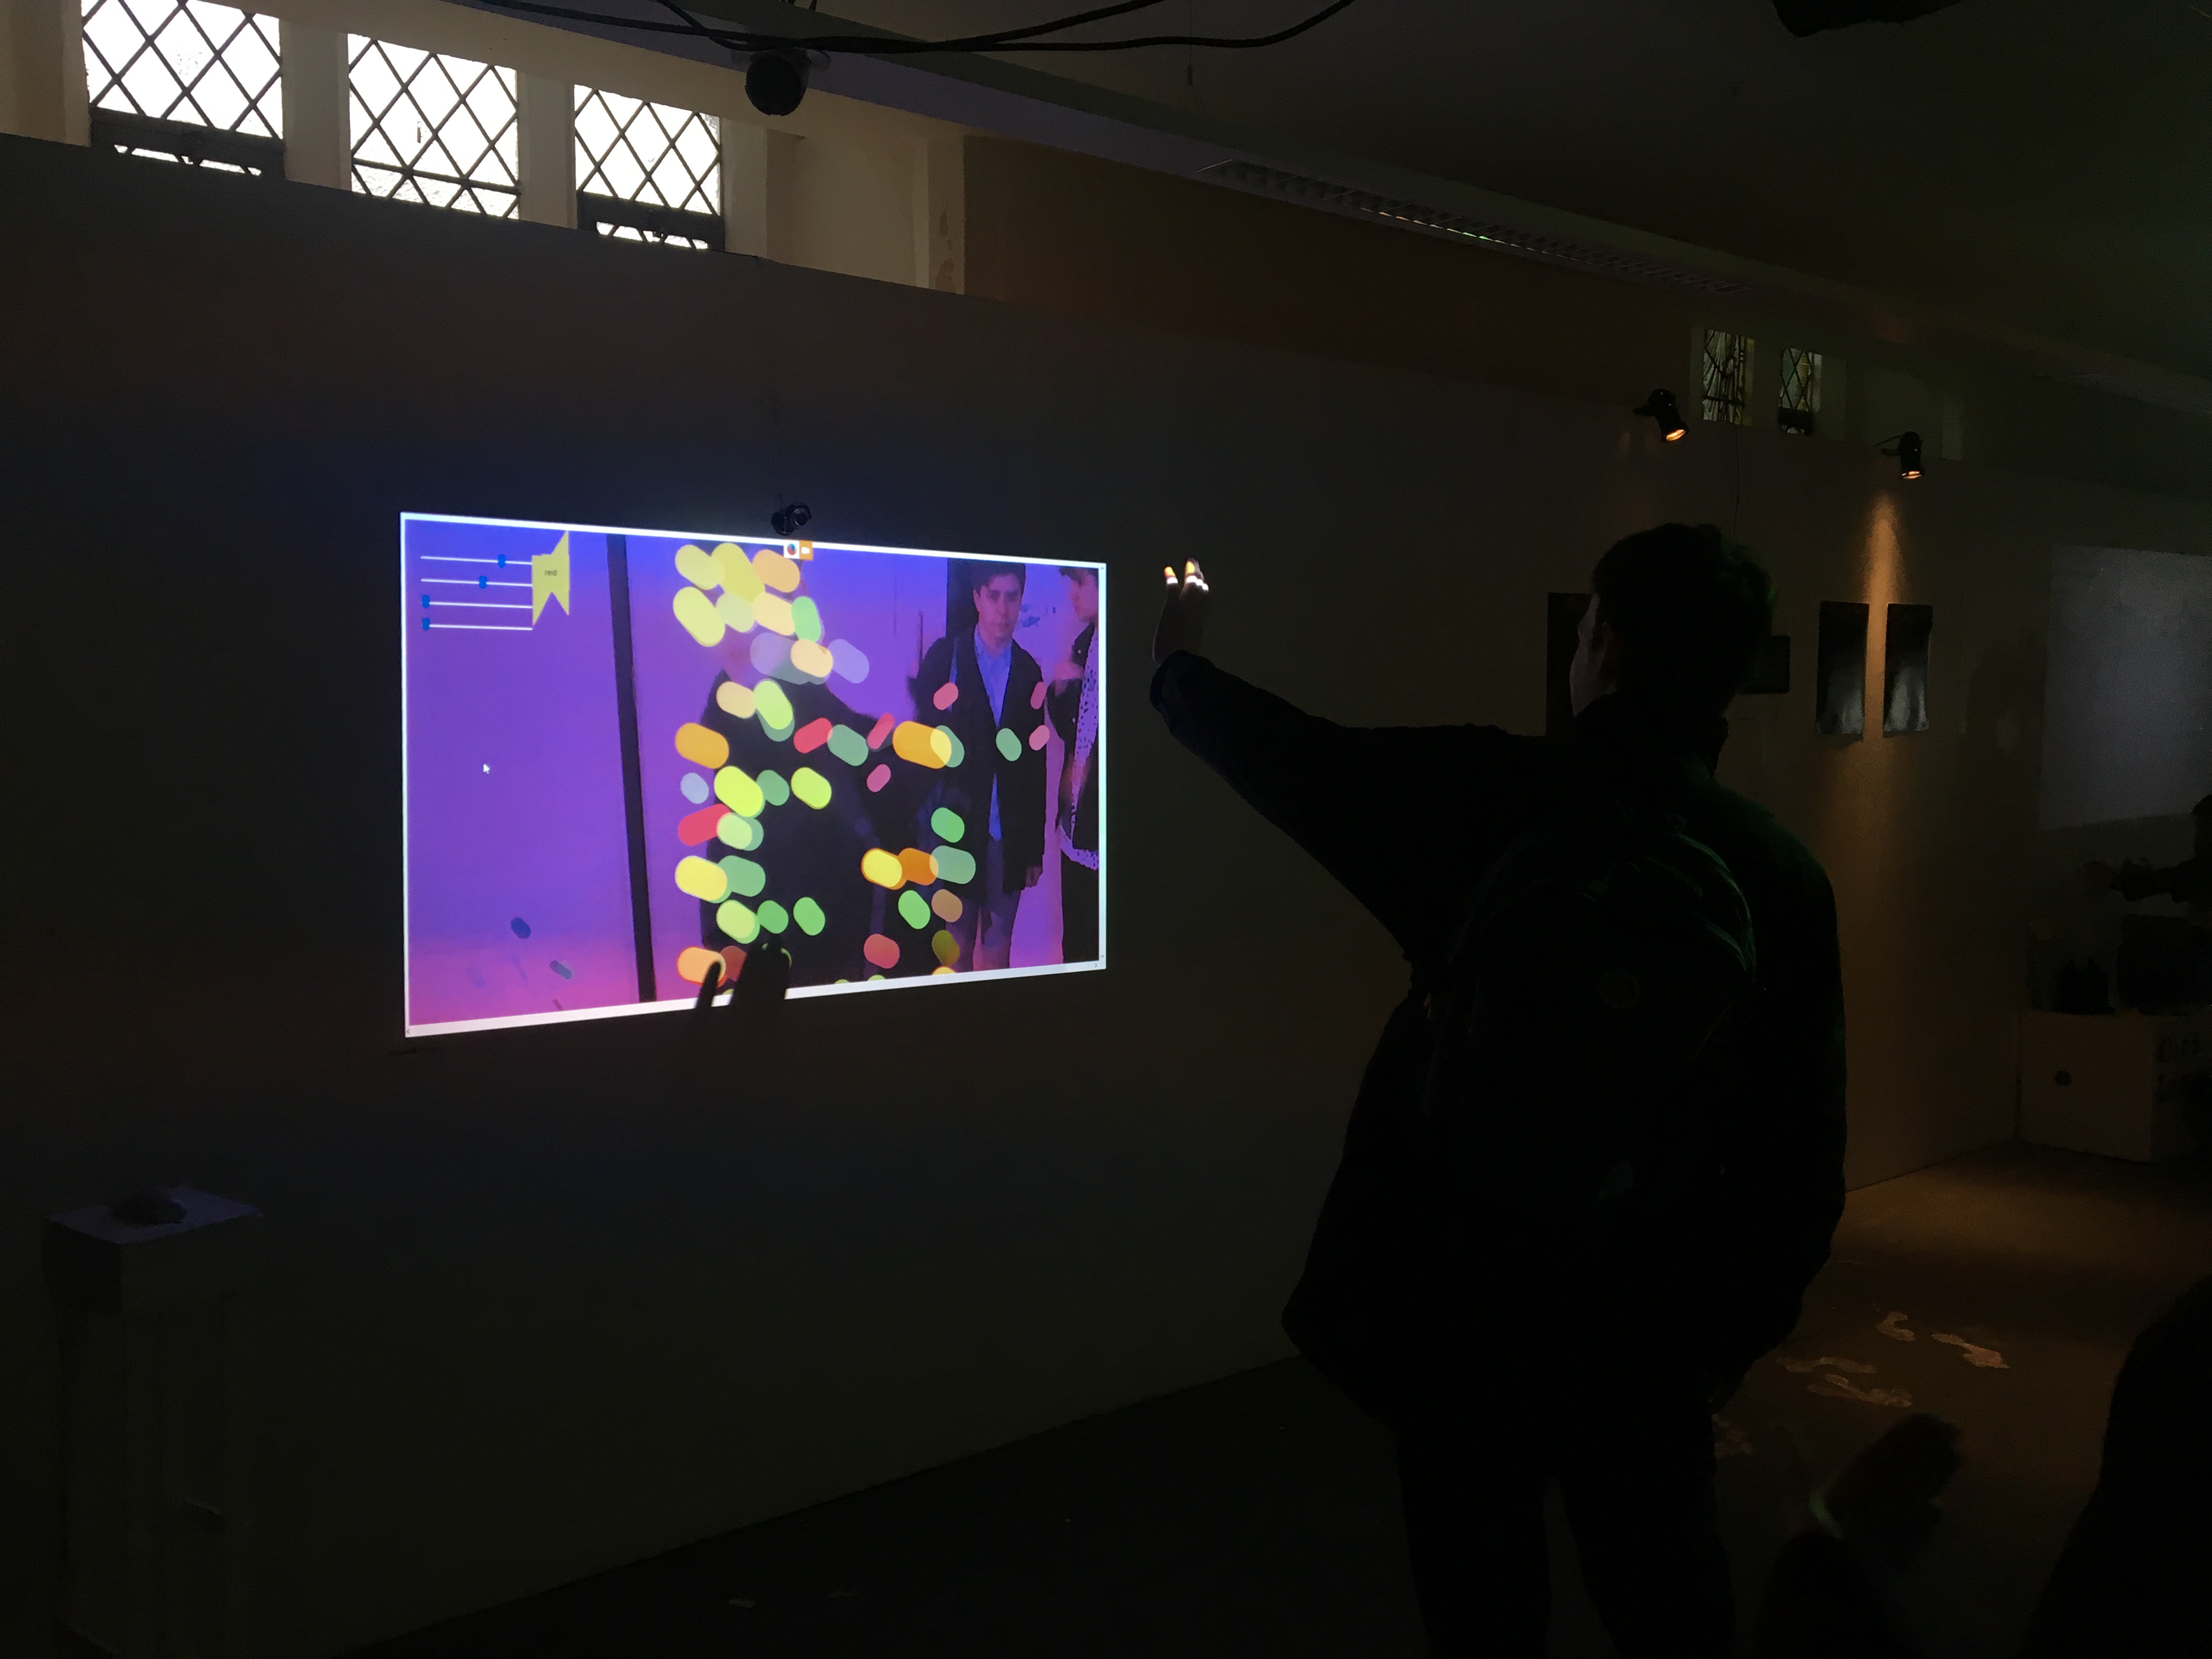
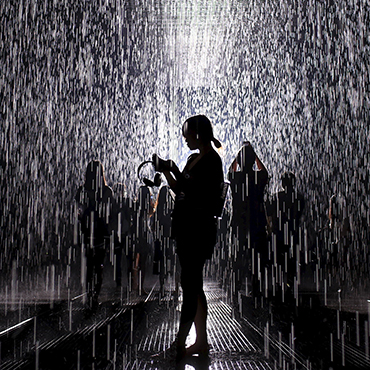
I became inspired by Digital Artist Casper Sawyer work titled objects and Artist Donald Judd both whom worked with placing objects within a gallery environment. I became most intrigued by Casper Sawyer work on objects and his decision to use an umbrella an everyday object as his exhibition, him been a digital artist and in a way stayed a way from any convectional Digital Art method some how creating an experiences I find refreshing and resting. This to me was something I wanted to have in my project yet more tied up with the Digital artist methods. Based on this I looked into Donald Judd to be more specific the era he work in, the high-Era for minimalistic art and the method used by artist in that specific period in time and what I found was they used already made industrial material and plastic which was fairly new to them at that time.
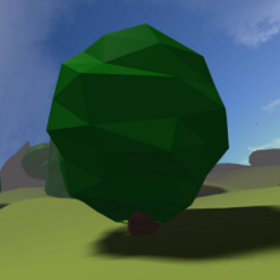
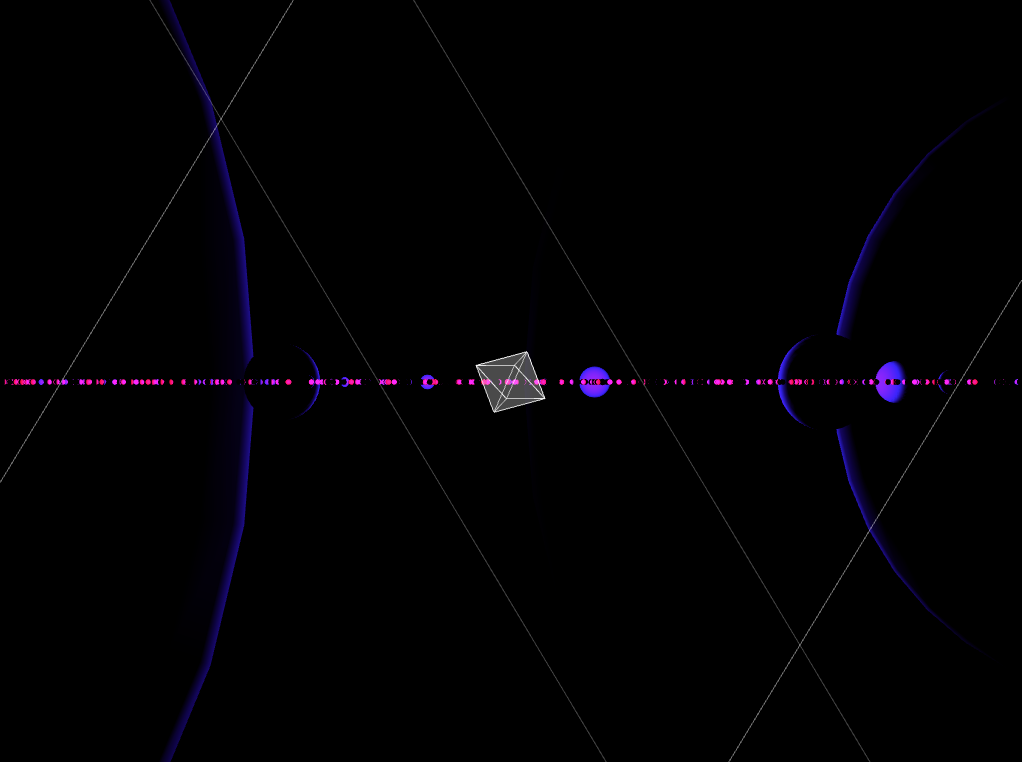
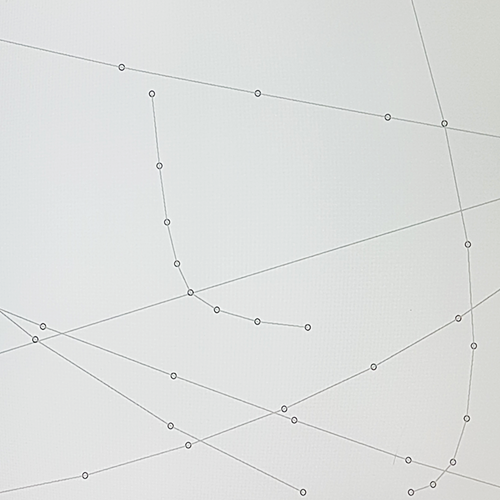
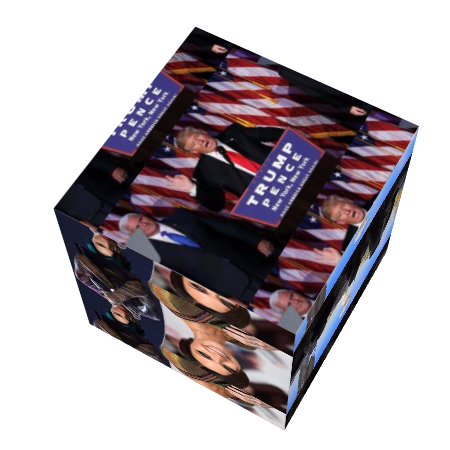
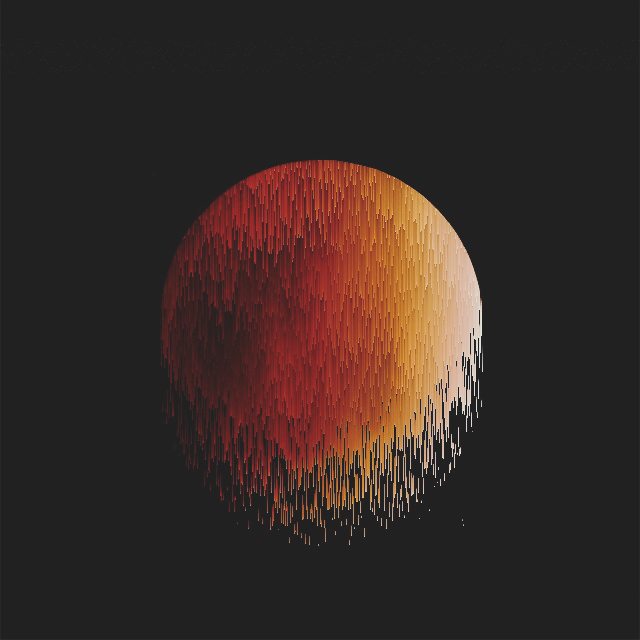
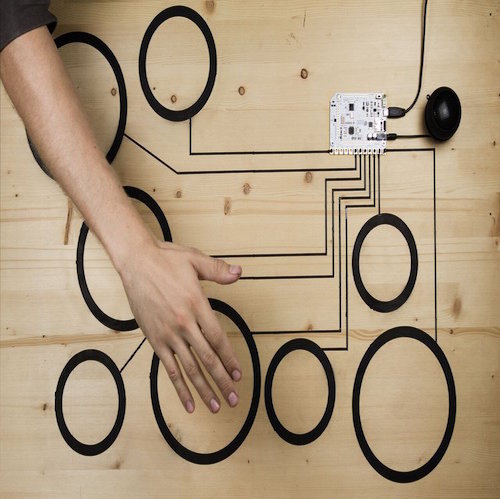
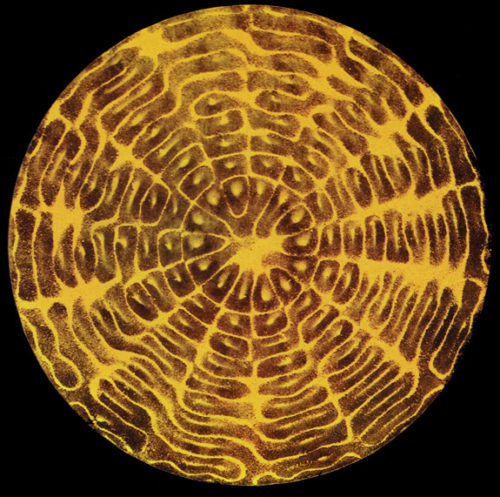
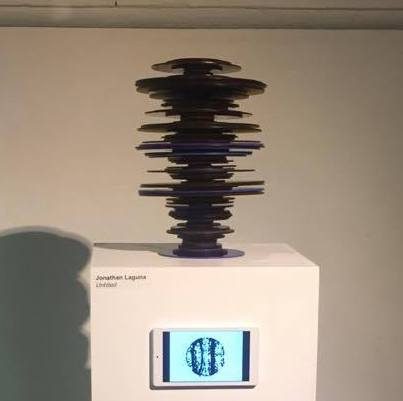
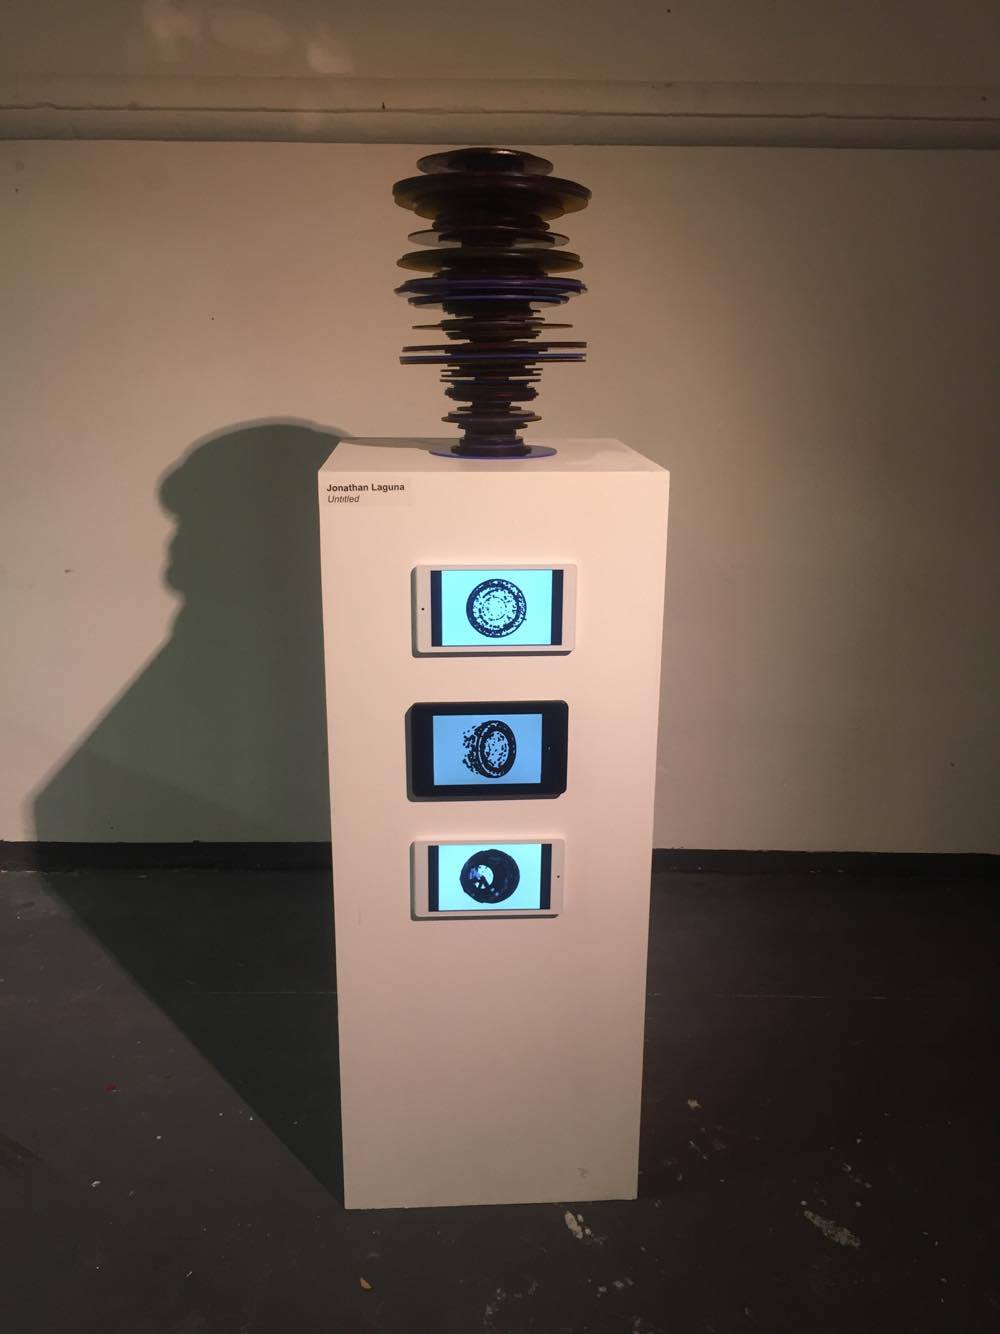
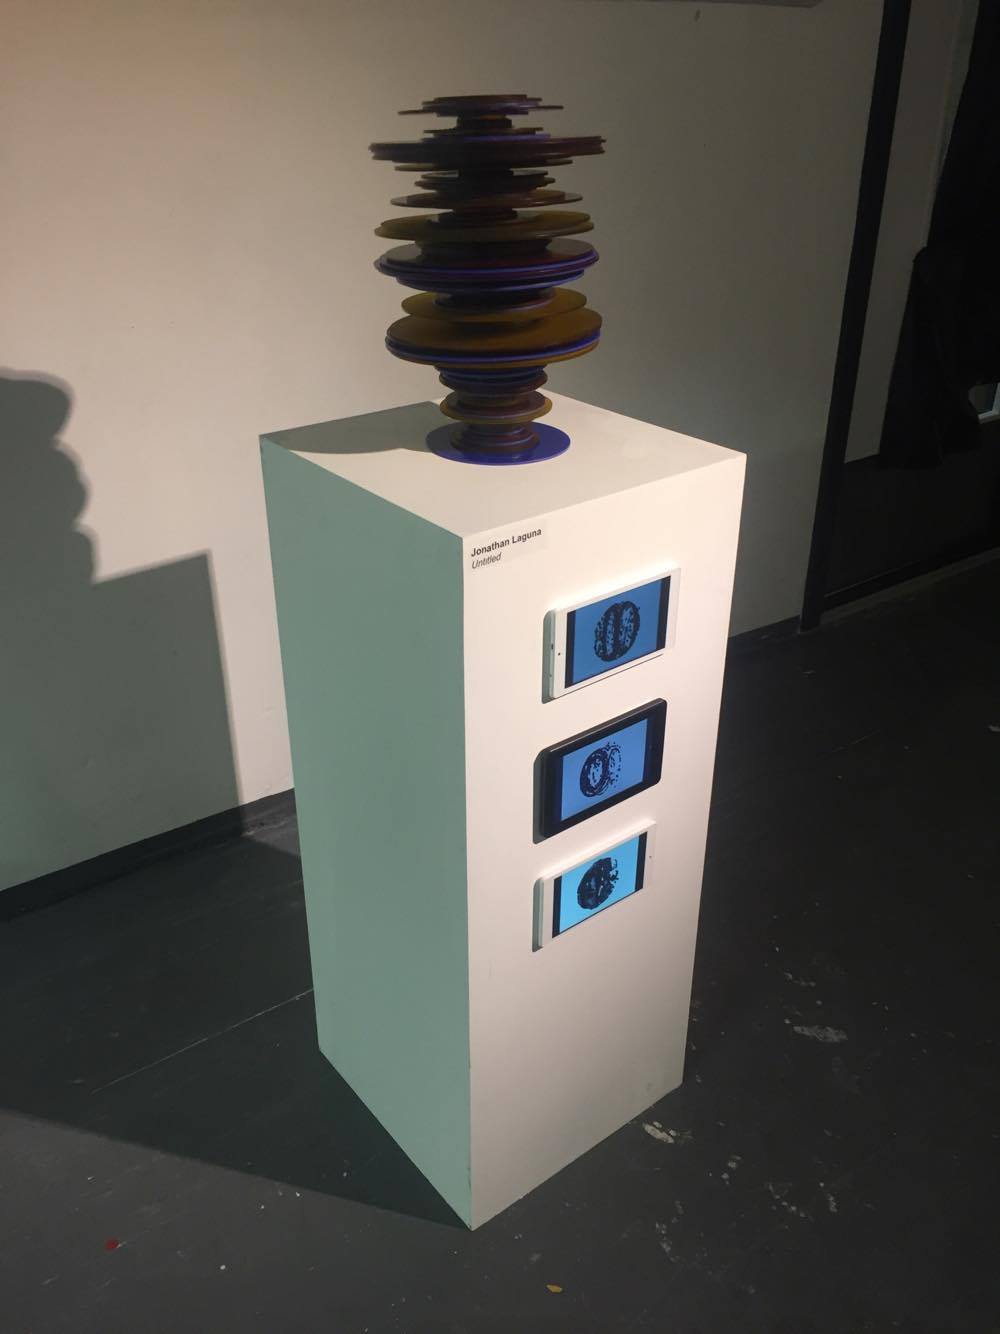
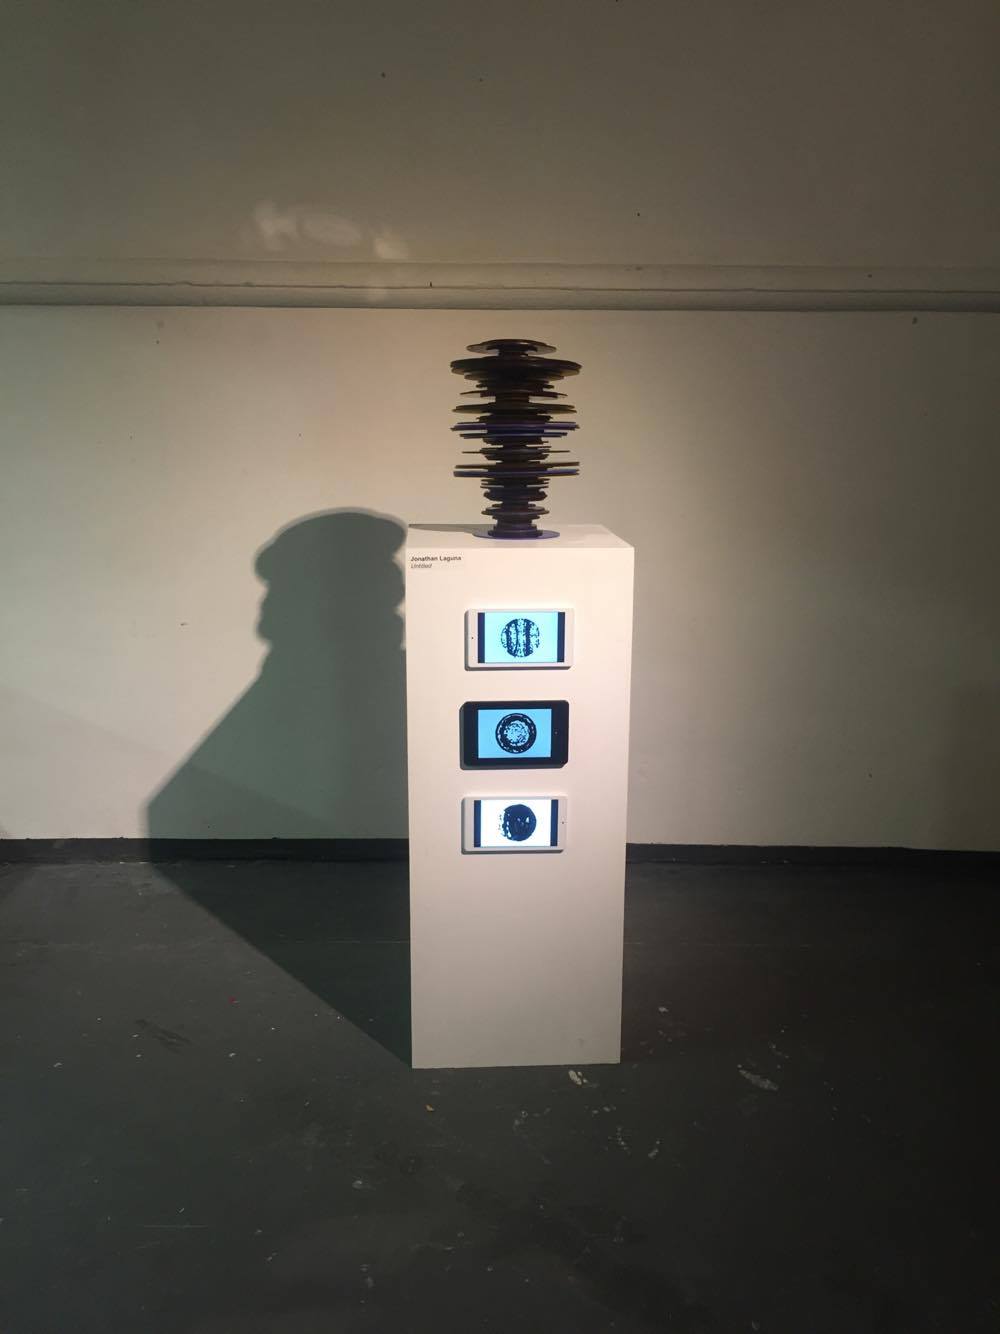
This influenced me too look for our or equivalent of fairly new methods which guided me to use laser cutting, acrylic and mass produce tablets as the hard media for my project which in a way guided the way I approach visualizing data. The visualizing of the data came to me as an unpleasant collaboration as I unwilling tied myself with a set of rules, which limited myself in many creative decisions this being that I limited myself to only using the values given to me by the Earthquake Data collected by the USGS as well as using OpenframeWorks as my main platform for programming the visualization of this data. I had to be creative with the way I went around the this issue and came up with the idea of visualizing the data in parts, to make it easier for me this had a great impact with the direction this project took place. I began looking at the data and how it was displayed and found that it was separated in columns with latitude, longitude, depth and magnitude, I thought that to visualize the magnitude in this data was by creating a circle of acrylic being that what I think about when hearing the word magnitude is this circle expanding in every direction in a 2D environment equally. I establish that to visualize it, in an object some how linked together, I would create a tower of the magnitude values from this data, using laser cut acrylic as my media.
I encounter that the were thousands of this records within a 30 days period, therefore I limited the to 135 recorded earthquakes and also found that some were too big or to small to support the weight of the object I intended to build so I had to skip some of them and create and instruction myself to use only recorded magnitudes values which were recorded within the values of 0.9 to 3.5 on the Richter scale, actually affecting the legitimacy of what I was making becoming the visualization of some earthquake which I fell in to my boundaries I was not happy with this.
I keep going still attempting to keep as close to the legitimacy of the data recorded, this in a way had a big impact in the way that the object when vertically as I build the object up based on the time recorded from being the latest would be base of this tower and the earliest the top, I began to make it upwards I had no saying, I had no saying in which piece came after the other and how it develop up I thought I had already intervened enough with the skipping of some records and restrain myself to affect any feather the visualization of the data. I realized that in many ways letting go of all creative decision becomes relaxing and freeing as let this unknown individual, computer or tool which happen to have recorded the magnitude of that specific earthquake, which now has taken part in this object in some form, it becomes surreal to me.
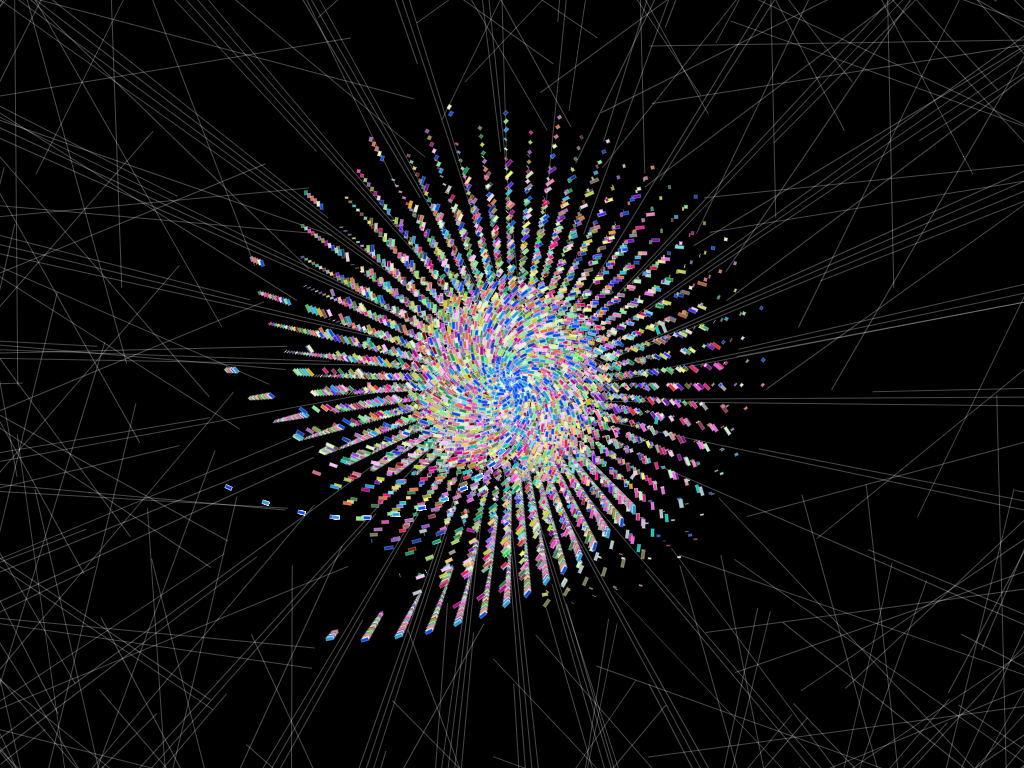
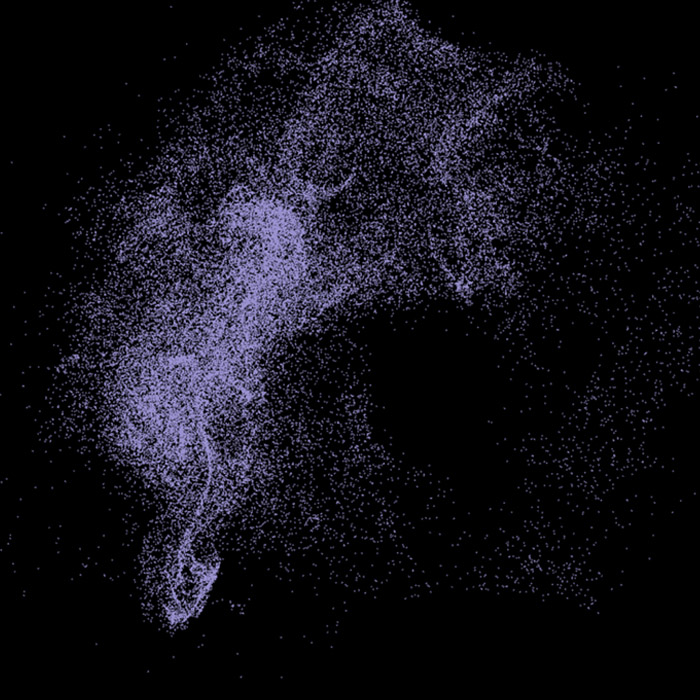
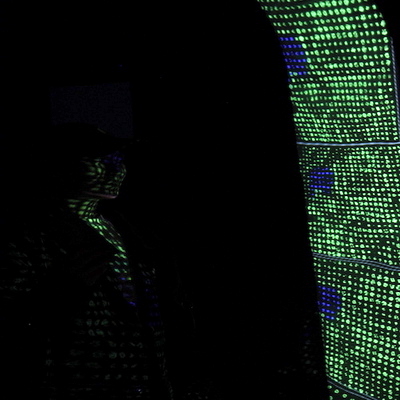
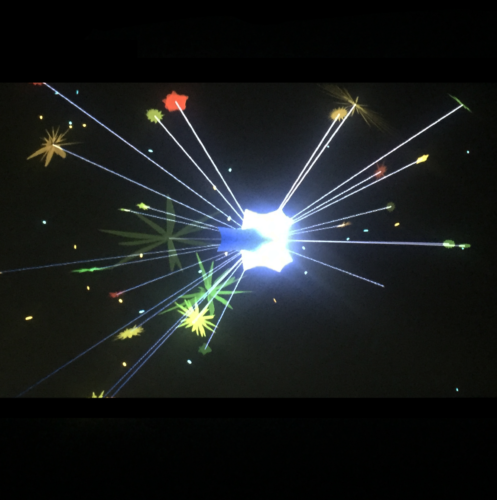
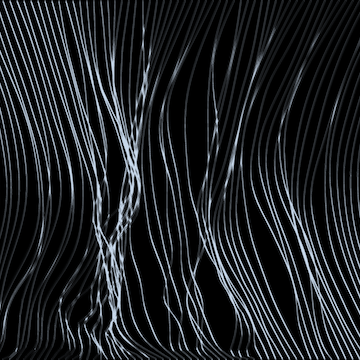
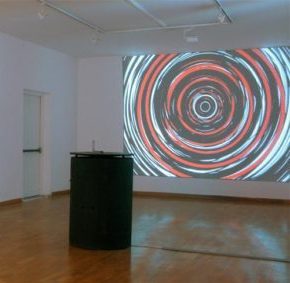
And so is the decision of 3 small animation which actually showcased the latitude, longitude and depth precisely as show in the data using the latitude and longitude to translate their position and the depth as shades from black to white based on the values recorded on the data, in a way out of guilt because of my intrusion in the visualization of the magnitude in the object, in many ways I wonder why I created the animation. In a way this project became therapist, and it opened up my view on decision-making and following decision, as well as my view on what collaboration in art, as I thought of it as a person-to-person or computational experience yet it I came to me in a form in the shape of a comma separated file.
Overall I believe this project it’s a failed attempt to accurate represent data though it has some aspect it isn’t fully being represented, I doubt if I had specific audience in mind as I was working in project other than myself and so to every body else its should be and an empty sculpture in space, empty of meaning, expression and symbolism, not entertaining in any way, some what baffling on its right to be in a Digital Arts exhibition. And I can’t help to think that in my failure to find something esthetically pleasing I in some way succeeded to achieve my aim.
References.
http://www.casparsawyer.com/objects.html
http://www.theartstory.org/artist-judd-donald.htm
http://www.tate.org.uk/art/art-terms/m/minimalism
Code.
Gitlab Repository : Codes - http://gitlab.doc.gold.ac.uk/jlagu001/Exhibition_codes