


Plant and Me
by: Emily Crosby
Introduction
Plant and me looks at the relationship between the plant owner and plant. Plants were grown over a few months with the height, stem width and shape of each plant are recorded over a period of a week with photos and notes. These were then scored, on a scale from 1 to 10, based on how well the owner thinks the plant has grown over the week. This data was then used with the genetic algorithm, by taking two random plants and switching selected values along with there being a chance of a mutation, to generate two new plants.
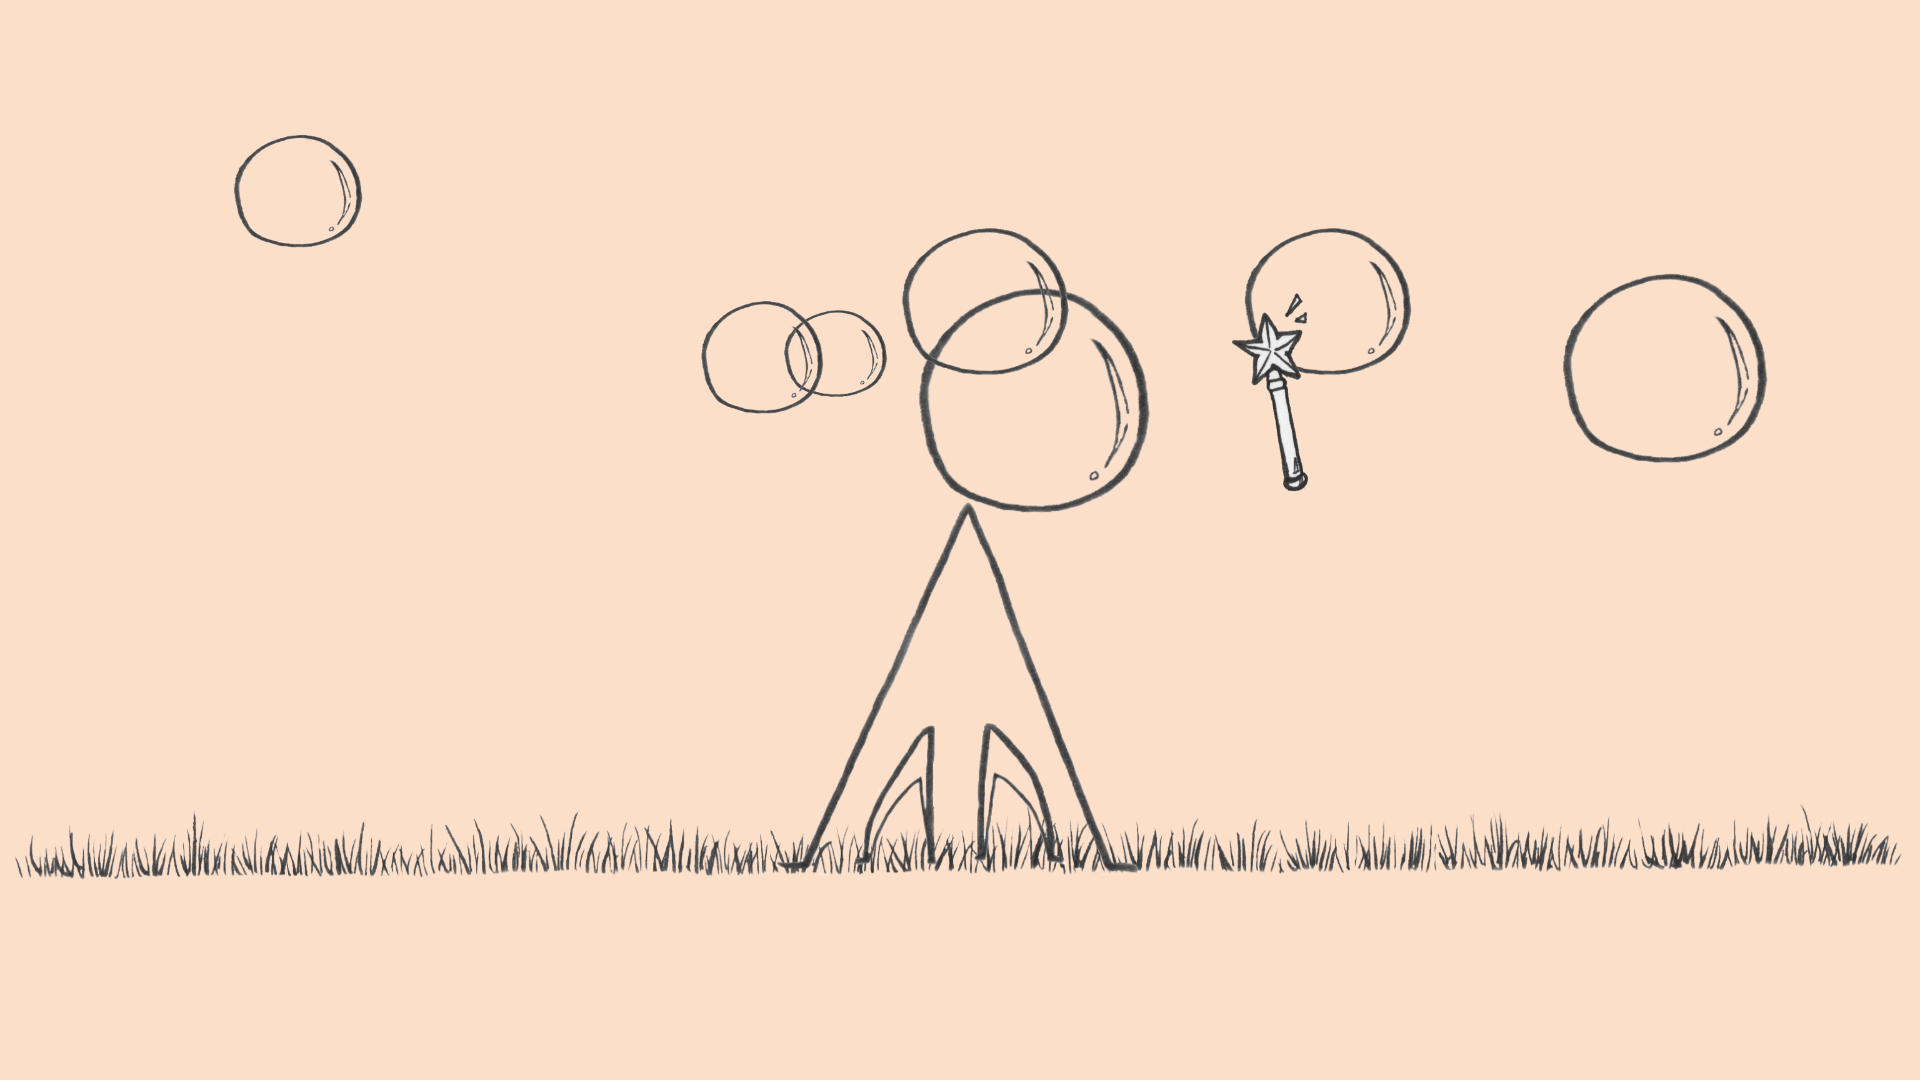
There are also hand drawn illustrations alongside digital drawings showing a comparison between the ‘old’ and ‘new’ types of media. The drawings are created by drawing the stems of the beansprouts and branching off the newly generated plants from the starting stems. The hand drawn images are a guess of how the owner thinks the plant will turn out and the digital drawings being the computers guess. The starting stems of both the hand drawn images and the digital drawings will be the same. The score given by the owner is used to generate a message that will be drawn onto the stem on each of the plants located on the digital drawings to give each stem an individual identifier. The idea was to generate ‘better’ plants in the next generations and to make a comparison between the new and old technologies with the new being the digital imagery and the old being the hand drawn imagery.
Background
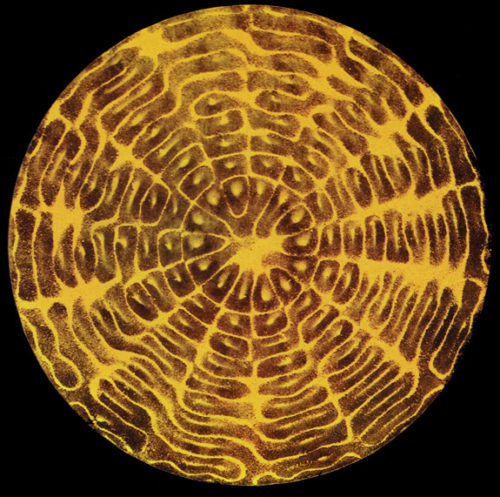
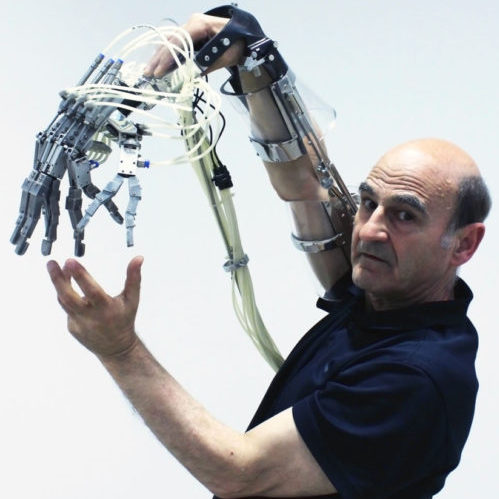
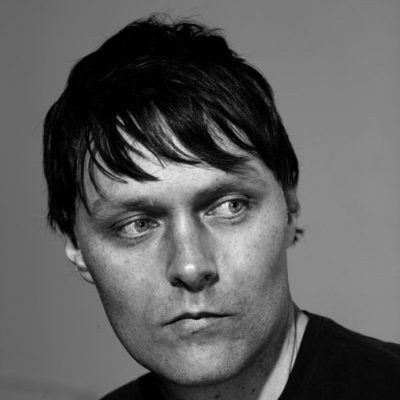
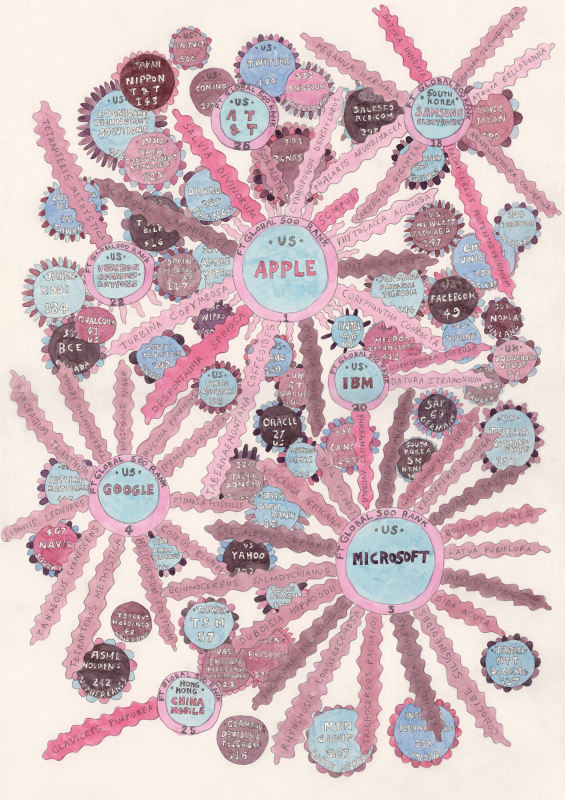
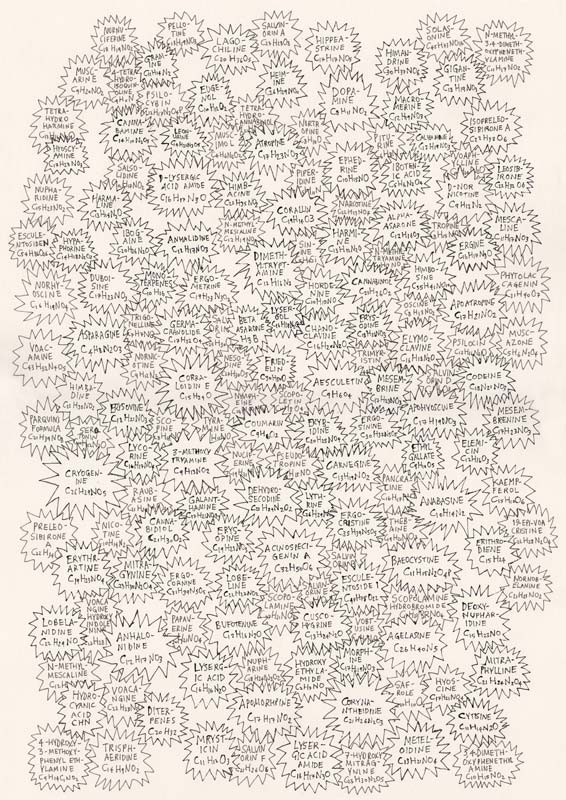
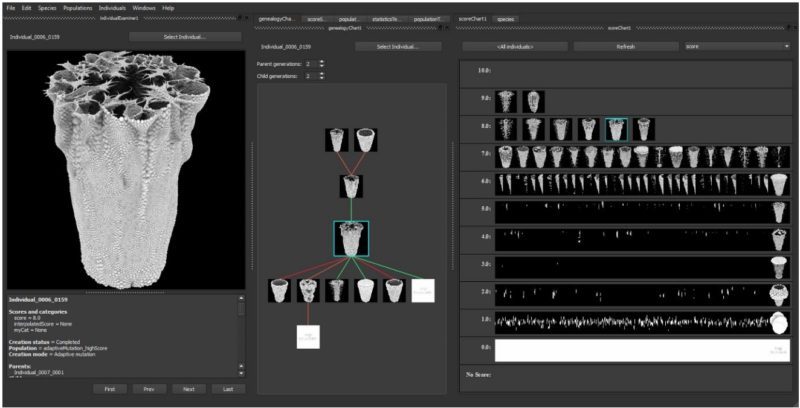
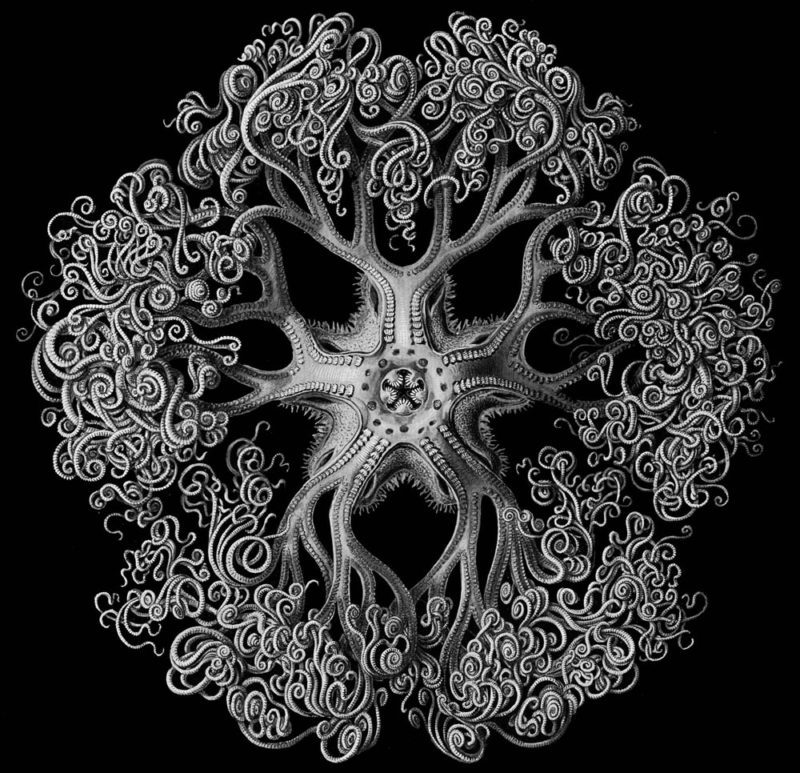
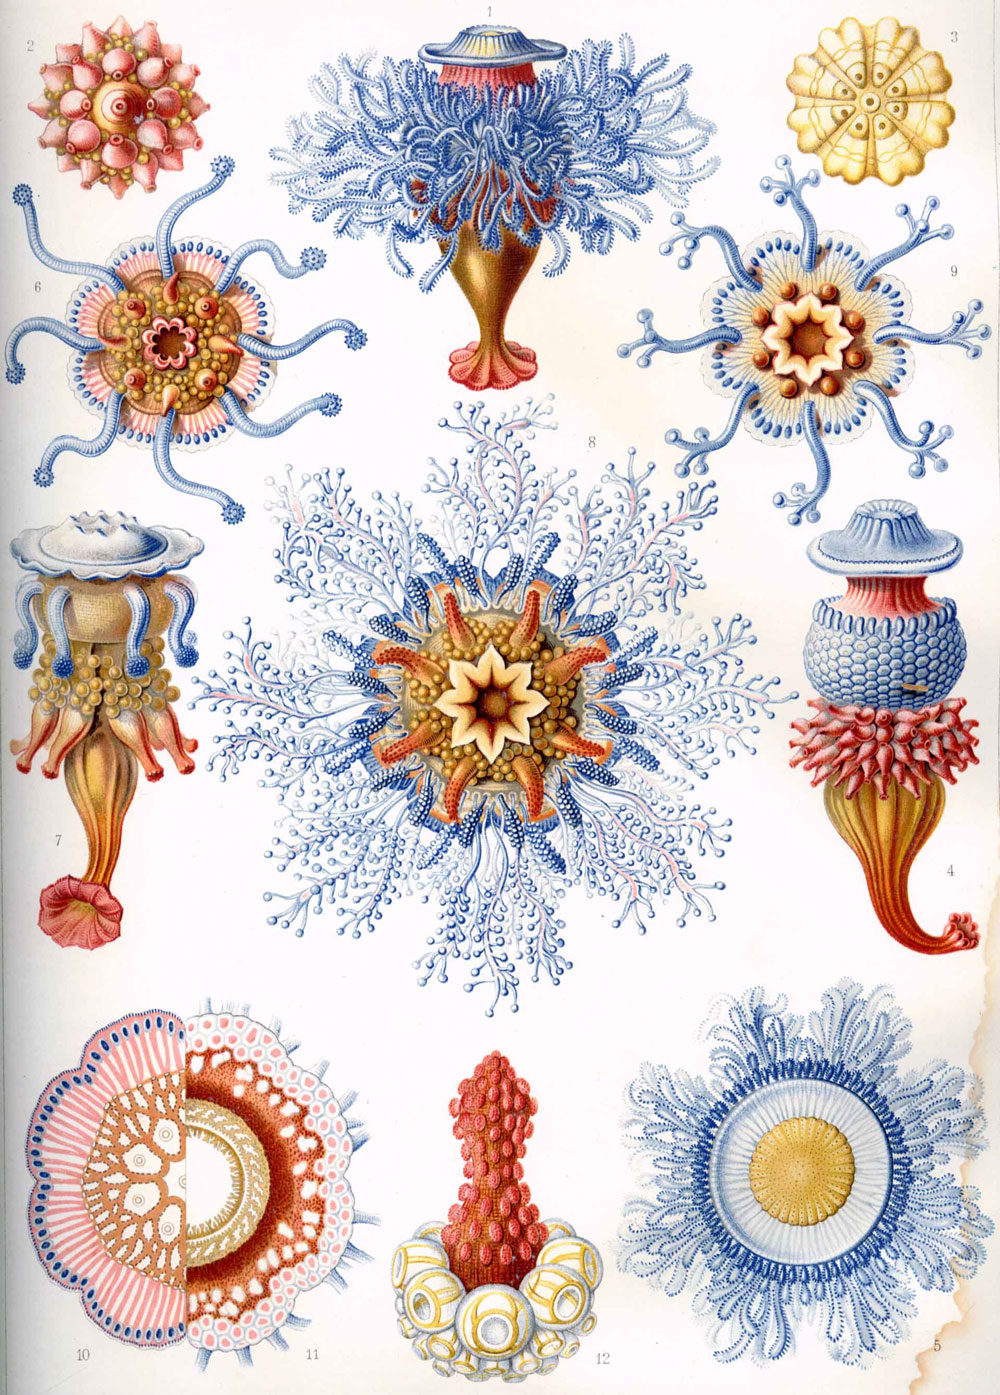
The genetic algorithm was something I learnt of when studying the natural computing module in the first term. I was interested in how the algorithm can create new populations without changing too much from the original. One of the guest artists in the module, Andy Lomas [1], demoed his program which generated new imagery and based on what score was given, would alter the output in a way that he wanted. I wanted to use this idea of scoring to allow me to have more control of the plants. The drawings of Ernst Haeckel [3] [4] had many examples of circular patterns that are found in nature and were what helped me develop the structure for the design of the hand drawings. I liked the style of his drawings and how the shape, patterns and structures of his drawings are captured. It did make me think whether I should display my drawings, both digital and hand drawn, similar to how a scientific sketch would be displayed. Suzanne Treister’s [2] diagrams were good inspiration as her unique ways of displaying data helped me develop the branching structure of my drawings. The diagrams were very interesting to me as they took data from the internet, which can be deleted very quickly, and put it into a physical form. This idea was something that my work tried to envision, by having a digital representation of the plants that can be drawn and deleted in a matter of seconds alongside a physical drawing that takes a lot longer to produce. This relates back to why I wanted to generate the new plants with the help of a computer as it would be a lot quicker and more controllable than breeding the plants manually which I probably wouldn’t have had the time to do. The comparison of the ‘old’ and ‘new’ media that is made draws attention to the idea that newer technology may not always be the best option and that older technologies can do the job just as well.
Technical Research
For my project, I needed to create a database to store all the data of the stems. I did this in Python using the sqlite3 library. I decided to use this library as I was familiar with it as I has used it in a project before university on my a level course. The library allowed me to create the Plant table which stored the height, width, shape, generation, parent and score of each stem and keep all the newly generated plants all in one place. I used this library to create and edit the database and also to store the newly generated stems. I also used the PyQt5 library to create a simple form interface to input new stem data into the database. I had to learn new SQL commands in order to randomise the order of the records so I could get random stems to display and to generate new stems from.
I used the genetic algorithm to generate new stems to add to the database. The algorithm took two random stems, then crossed over the width and height value, with a random chance of one of the values mutating. The score for both of the new stems is then calculated by taking random stems from the database with the same shape as the ‘parent’ stems and calculating the score based on the ratio of the average heights of the random stems to the new stems height. This algorithm was used as in newer generations it doesn’t create anything that is too different from the original. It was good as I didn’t have to filter out any outliers.
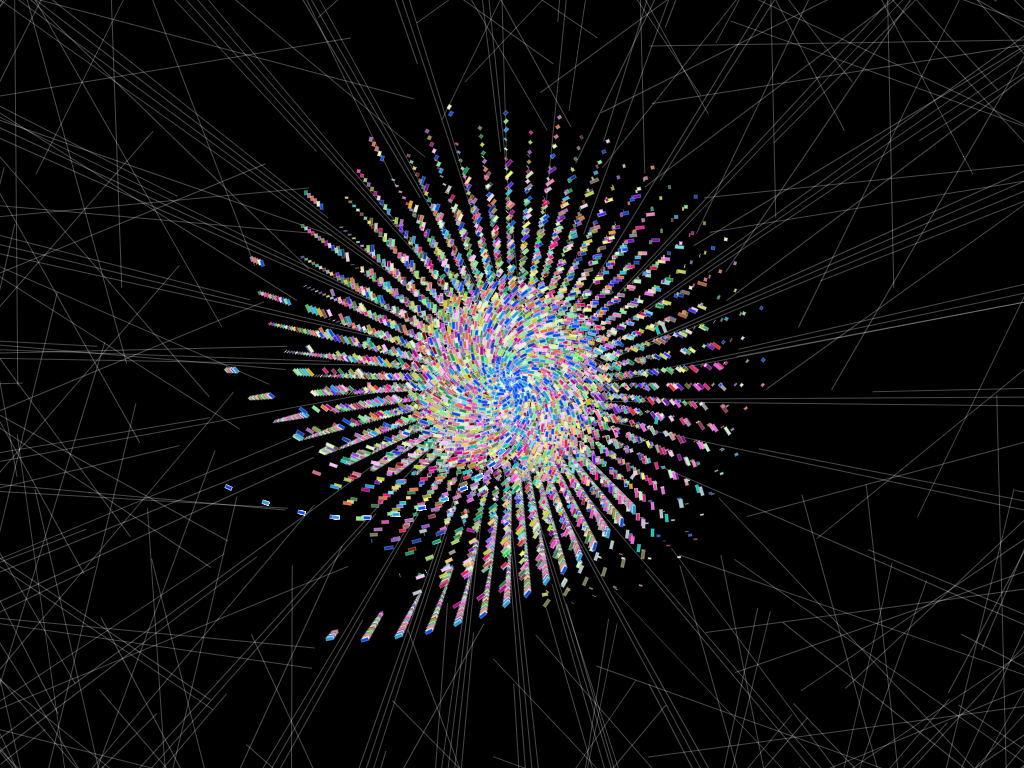
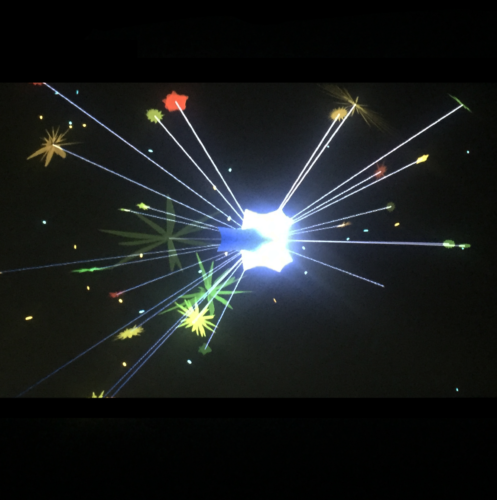
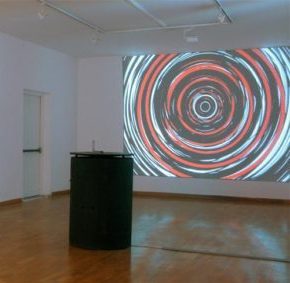
Originally, for my digital representation, I was going to have an animated sketch which would be projected on the wall showing the animations all collaged together but, I didn’t go with this idea as I thought it would be too distracting from the rest of the piece and would be too different from the sketchbook drawings. Instead I decided on having still images so it would be easier to compare the digital to the traditional.
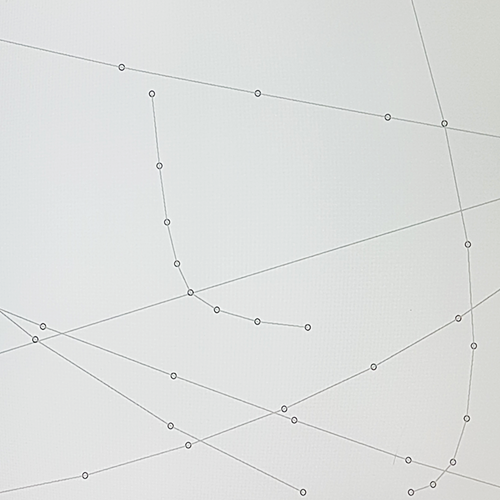
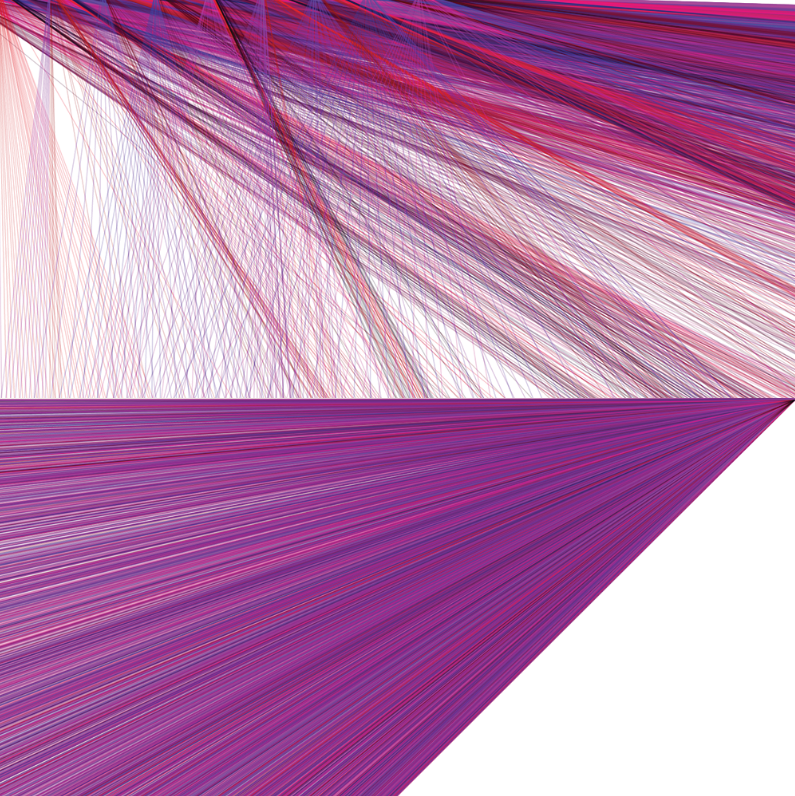
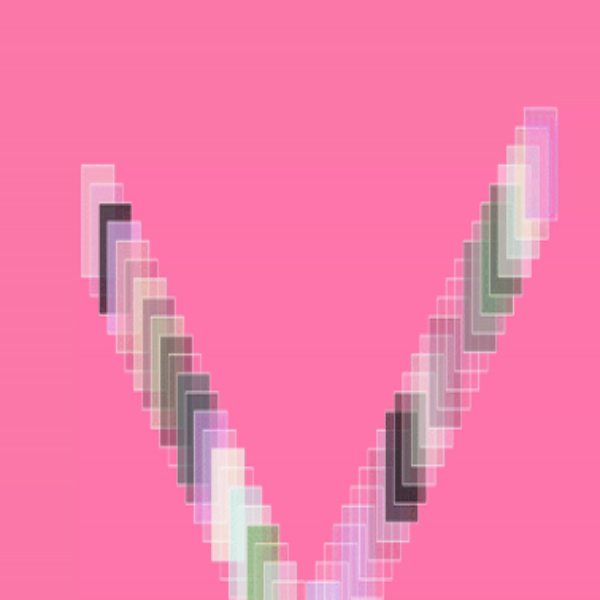
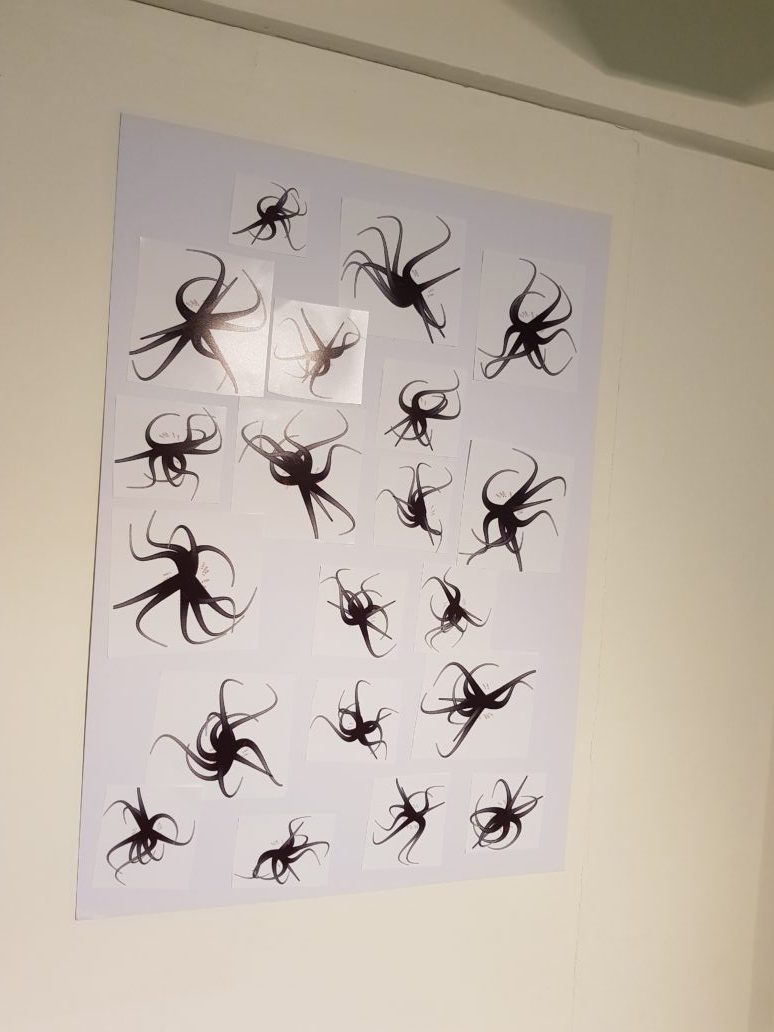
I created the digital drawings using processing, I used the BezierSQLib library to connect to the SQLite database that I created and to take the data out of the database to change the stems shape, height and width and output the score. The digital drawings were created by using a bezier curve, with each shape having a different curve, and then drawing circles, which gradually got smaller, along the curve by using the bezier point function [5] to figure out all the points on the curve. I was going to have the digital drawings branching off one another like the drawings in the sketchbook drawings but could not get the code working, as I wanted it to, in time which sort of links back to the idea that newer technology may not be the best option which is something I agree with, considering how I handled this project. It ended up with the stems, from every generation, being randomly chosen and then each stem drawn at a different angle around the middle point.
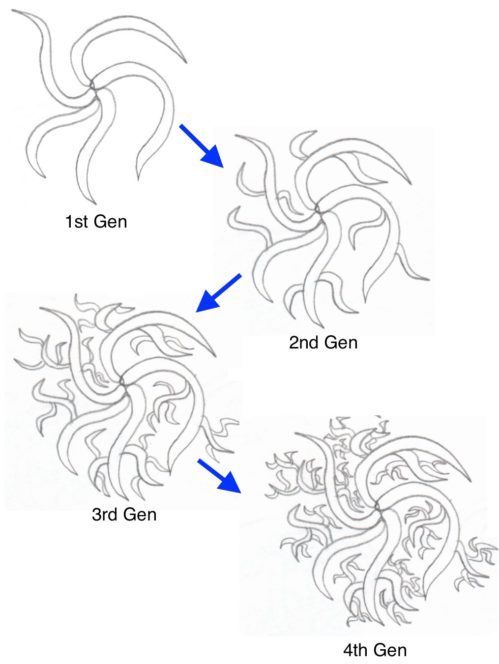
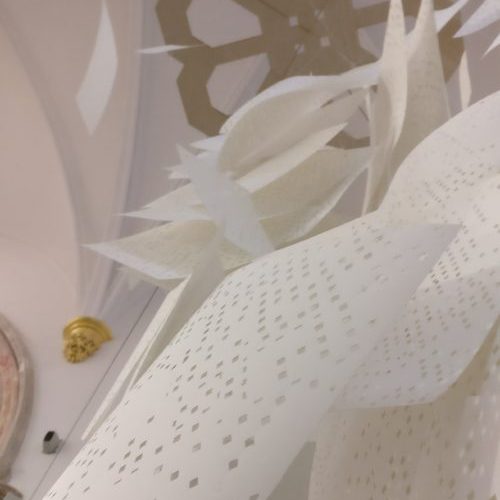
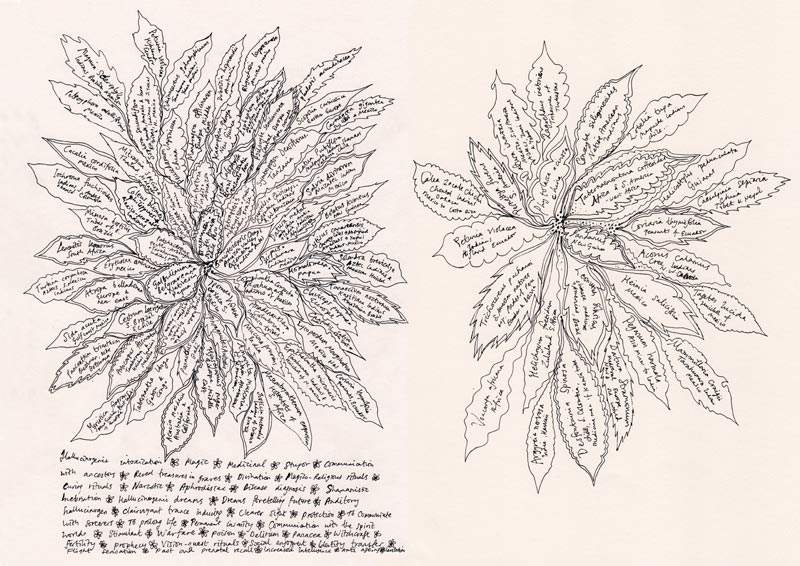
The sketchbook drawings were drawn to image the process of how the digital drawings would have be created. It does this by the way it was drawn, I drew one generation of stems at a time, so I’d draw all the first generation stems, then I’d draw all the second generation stems and continued that process until four generations were drawn. This was how it was supposed to be for the digital drawings. The drawings show a older form of media doing what a newer form of media should be able to do more easily. The difference being that the traditional drawings use imagination and intuition of the drawer to create different imagery whereas the computer relies on randomness to create differences in what is drawn. Of course the computer is more likely to recreate the same image again as the computer is following the same instructions every time but the owner is affected by many outside factors such as their mood, health ect.
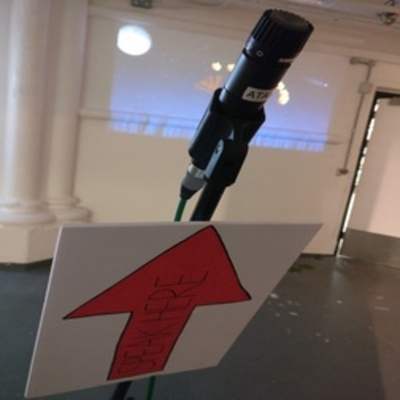
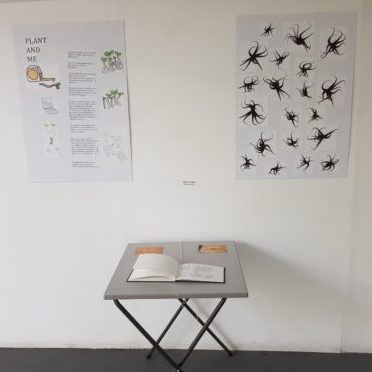
The Setup
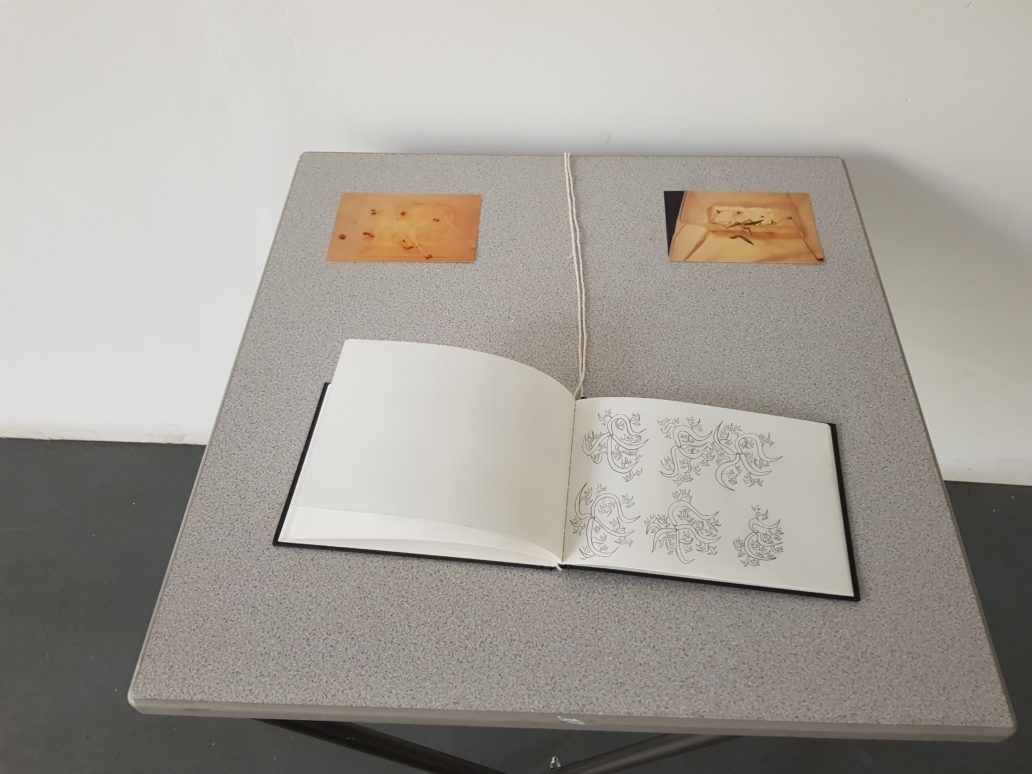
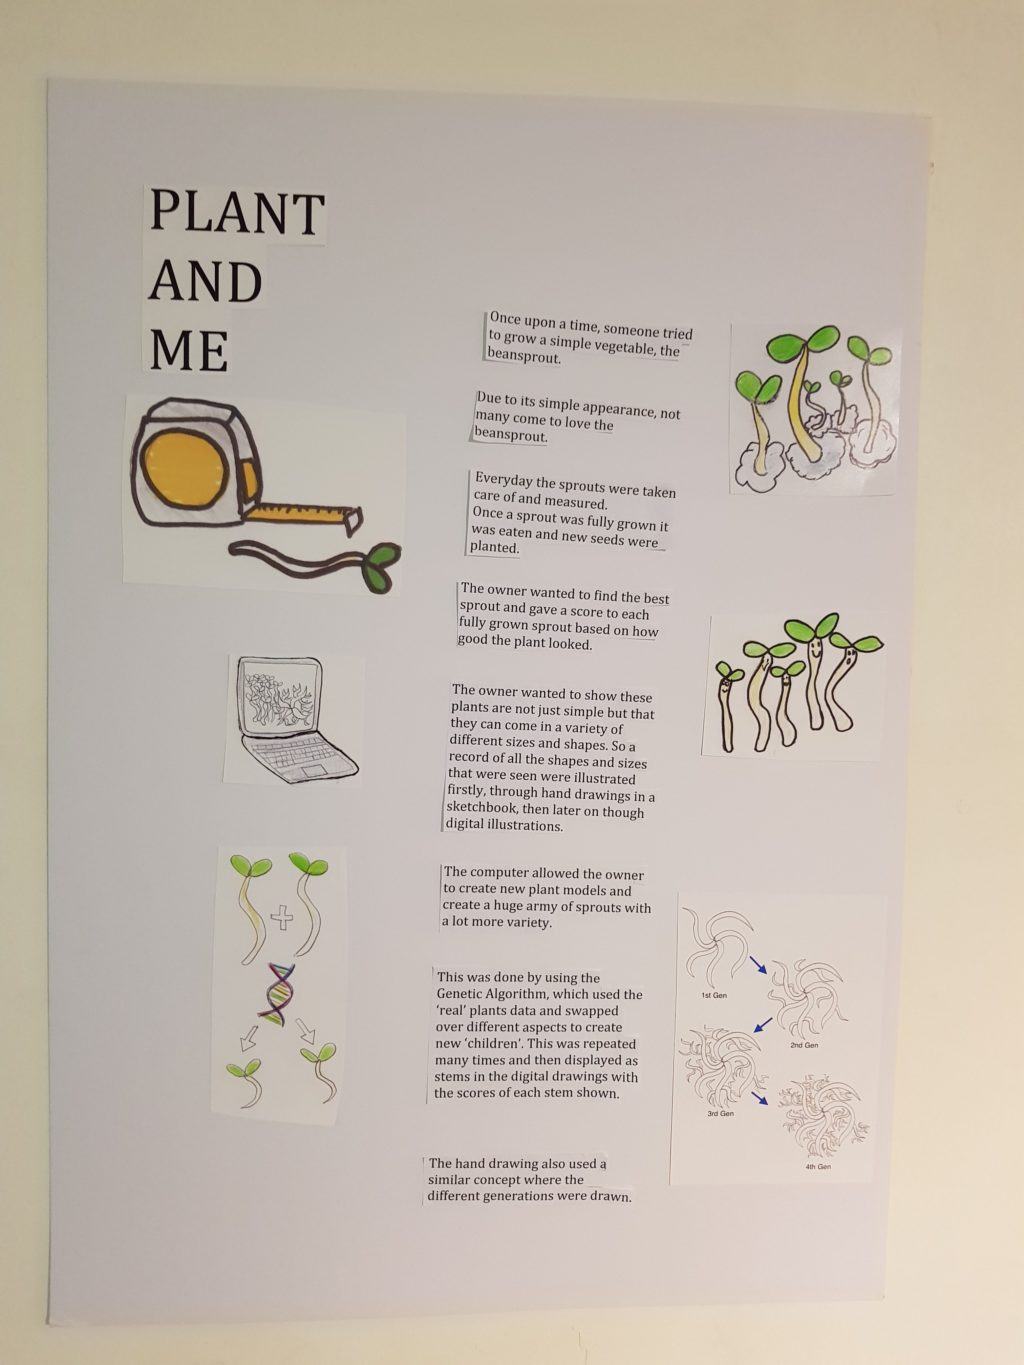
The piece was made up of two posters, two photos and a sketchbook. The posters depicted on one side the newer form of media being the digital prints and on the other the older form media telling the story of the plant and owner using hand drawn images like in the sketchbook alongside it. The photos were of some of the beansprouts during the growing process.
Evaluation
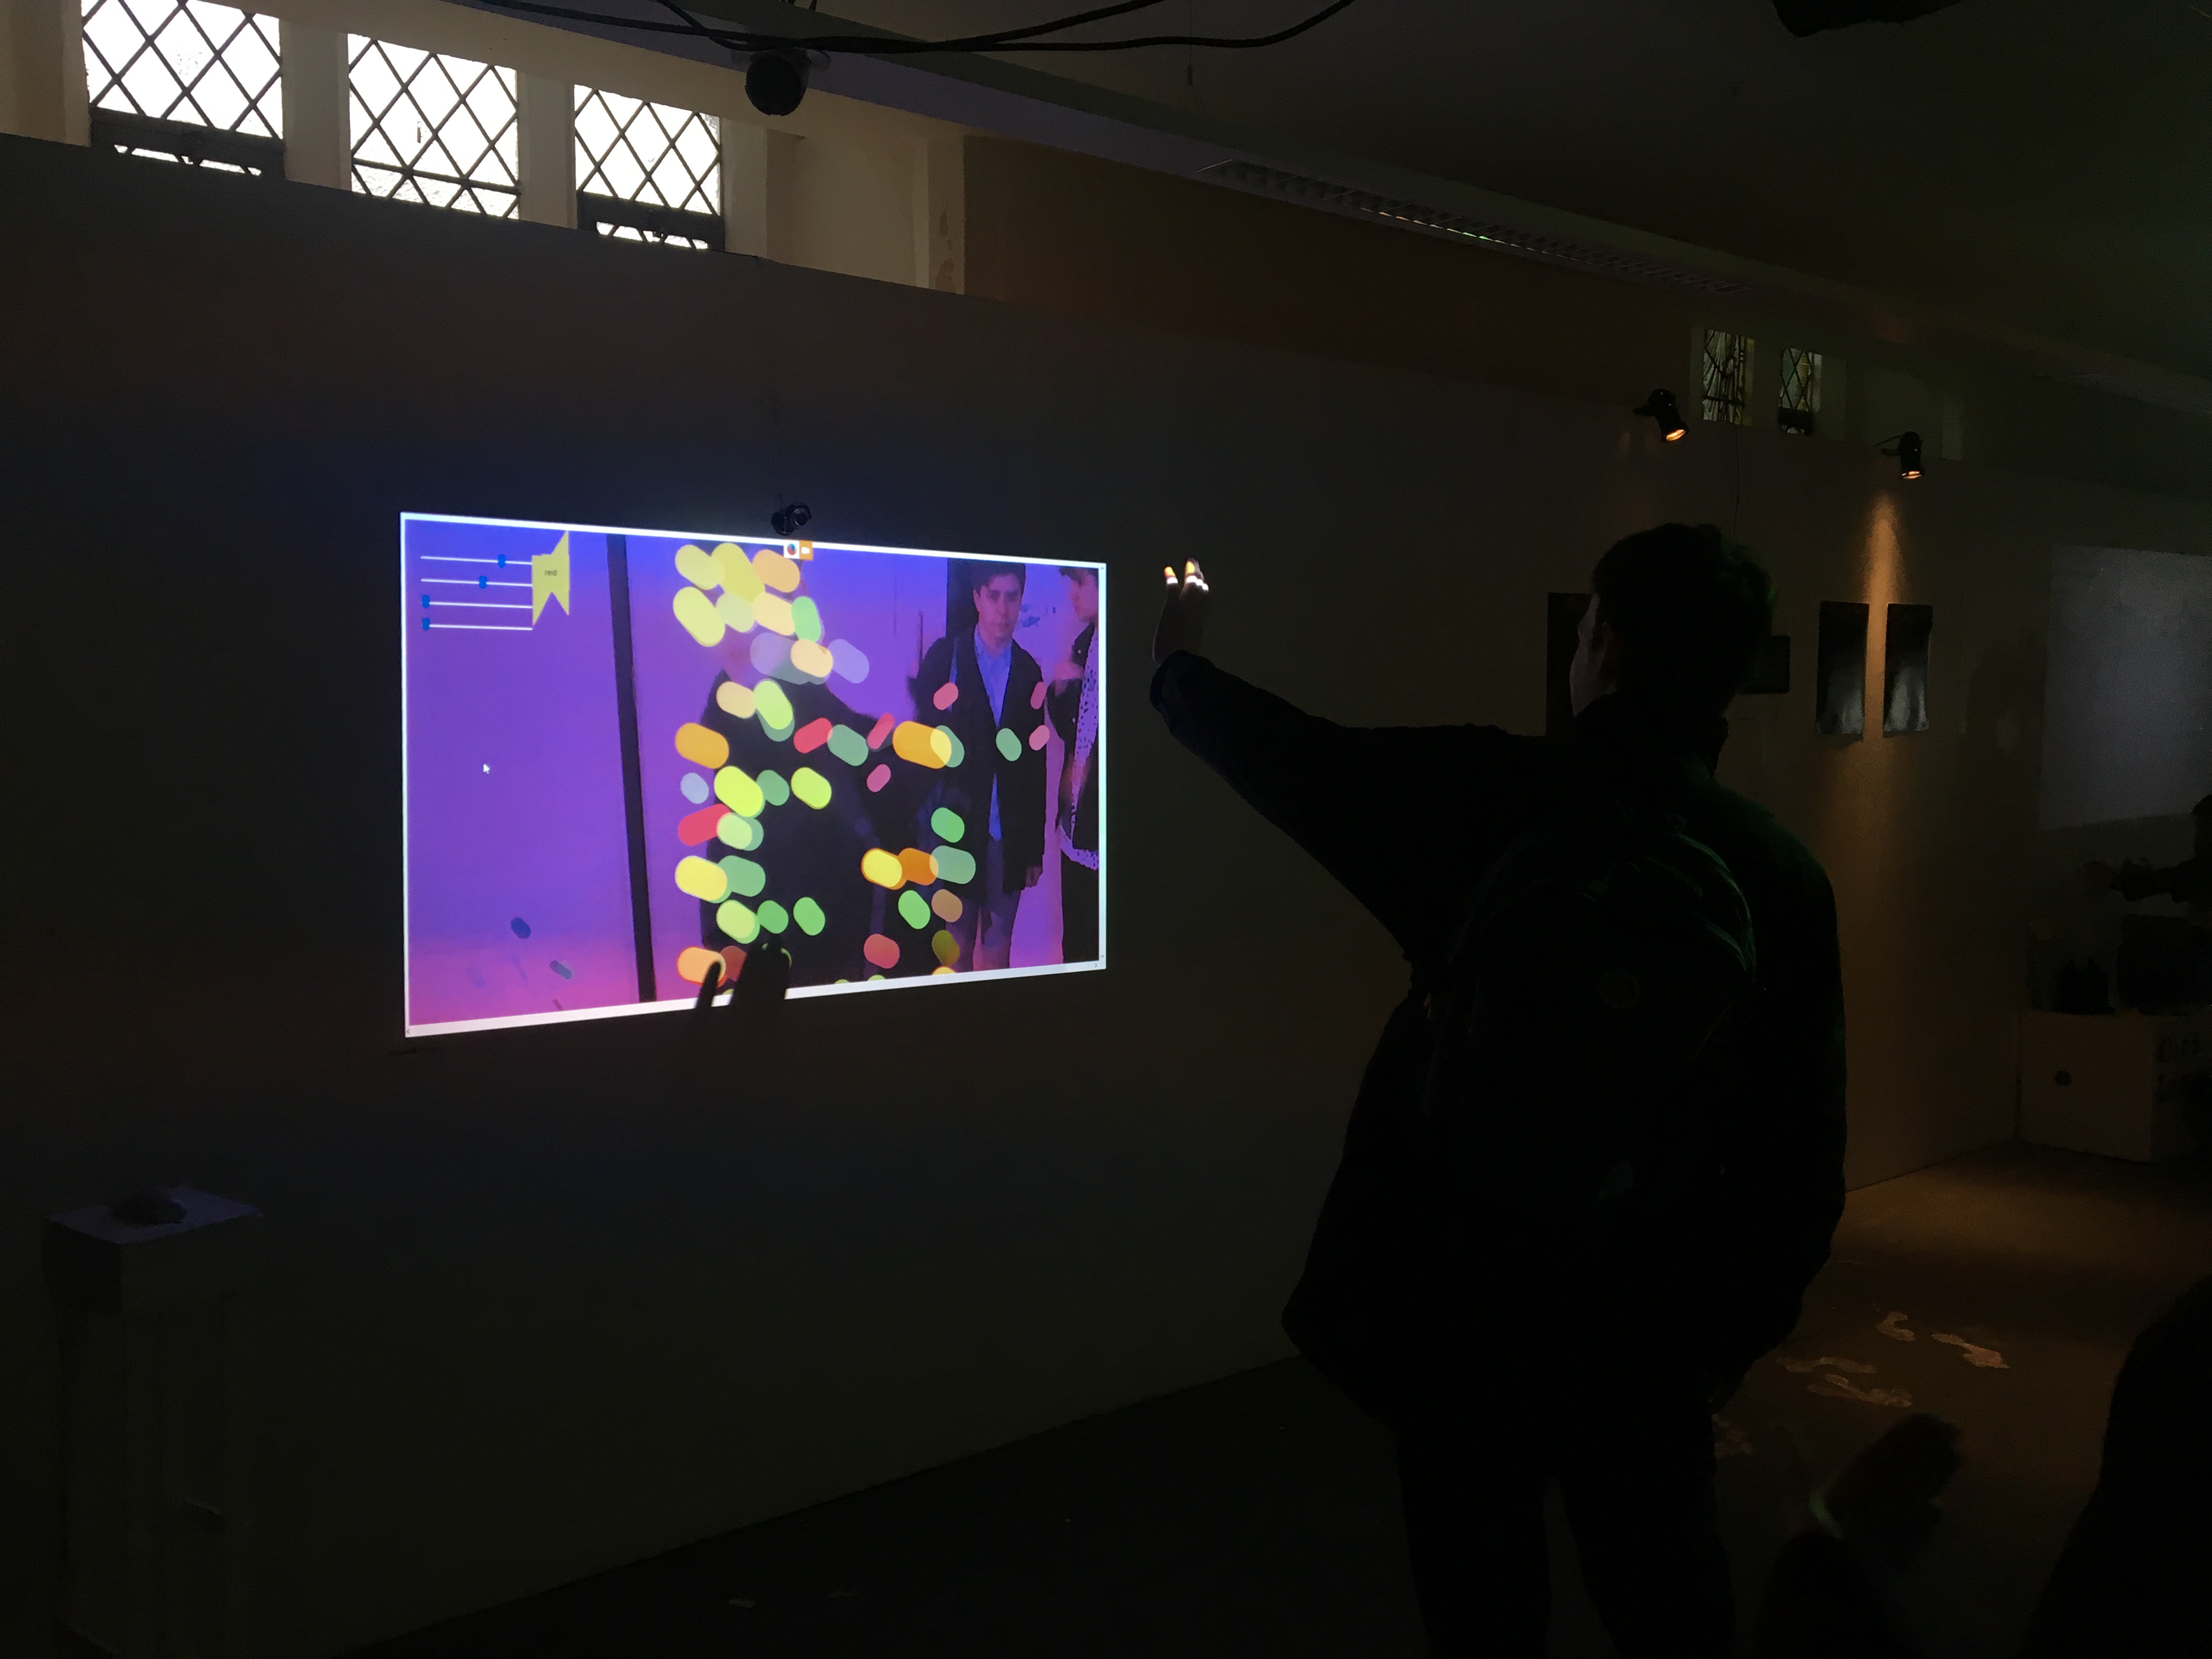
To the audience I was trying to communicate the story between me and the plants and how I got to the current work and also the comparison of the ‘old’ and ‘new’ media forms. At the exhibition, the main reaction was that the piece was ‘interesting’ and that it was different as other people would use the genetic algorithm to create something complex whereas I used it for something simpler. The imagery attracted people to the piece though with some people saying it would be more eye-catching if I had them printed bigger which I understood as there were some people who didn’t stop to look at the work. I also think I should have maybe made the text a bit shorter as I found that there were a lot of people who stood in front of the poster for a long time or didn’t read the poster and asked me to explain everything.
I think the link between the traditional and newer forms of media was not shown particularly well, maybe due to me using printed text instead of handwritten text for one of the posters. I could have done better with both the layout and into how I displayed the work and I should have taken more time and care into positioning and the size of each drawing.
I also would have liked to have created the program completely in Python and also have a fully working program with a easy to understand graphical user interface. This would also be better as I could show how the genetic algorithm is used more clearly than it is now.
In the end I wasn’t completely happy about how my piece looked in the space. I think it would have been better if the poster that told the story was completely drawn by hand instead of having printed text as it takes away from the more traditional form of media and made it harder to understand the link between it and the digital imagery. If I were to do the piece again, I would make sure I had started on my code a lot earlier and that I had it done a lot earlier as well. I would also make sure that I had a well laid out poster and made sure I had and used the right equipment to properly align and cut the contents of the poster.
References
[1] http://ewic.bcs.org/upload/pdf/ewic_eva16_arts1_paper1.pdf
[2] https://www.suzannetreister.net/HFT_TheGardener/HFT_Diagrams.html
[3] http://linesandmarks.com/ernst-haeckel-observations/
[4] http://www.rarebooksberlin.de/fileadmin/haeckel_artforms.pdf
[5] https://processing.org/reference/bezierPoint_.html
Gitlab Repository
http://gitlab.doc.gold.ac.uk/ecros052/FinalProject