Example 1. Comparison of the alpha-globin locus in different cell types:
CSynth has been used to model the mouse alpha globin locus using data from erythroid cells and embryonic stem (ES) cells. Matrices were generated from TriC data at 4kb resolution. This data is published in Nature Genetics (Oudelaar et al, 2018).
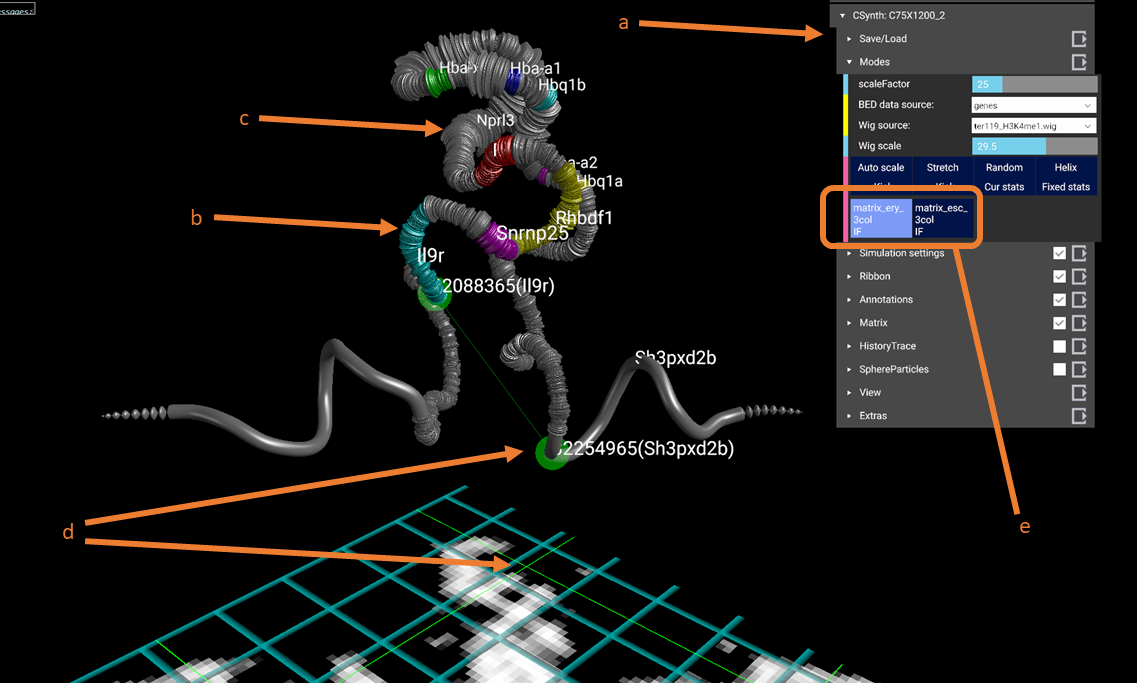
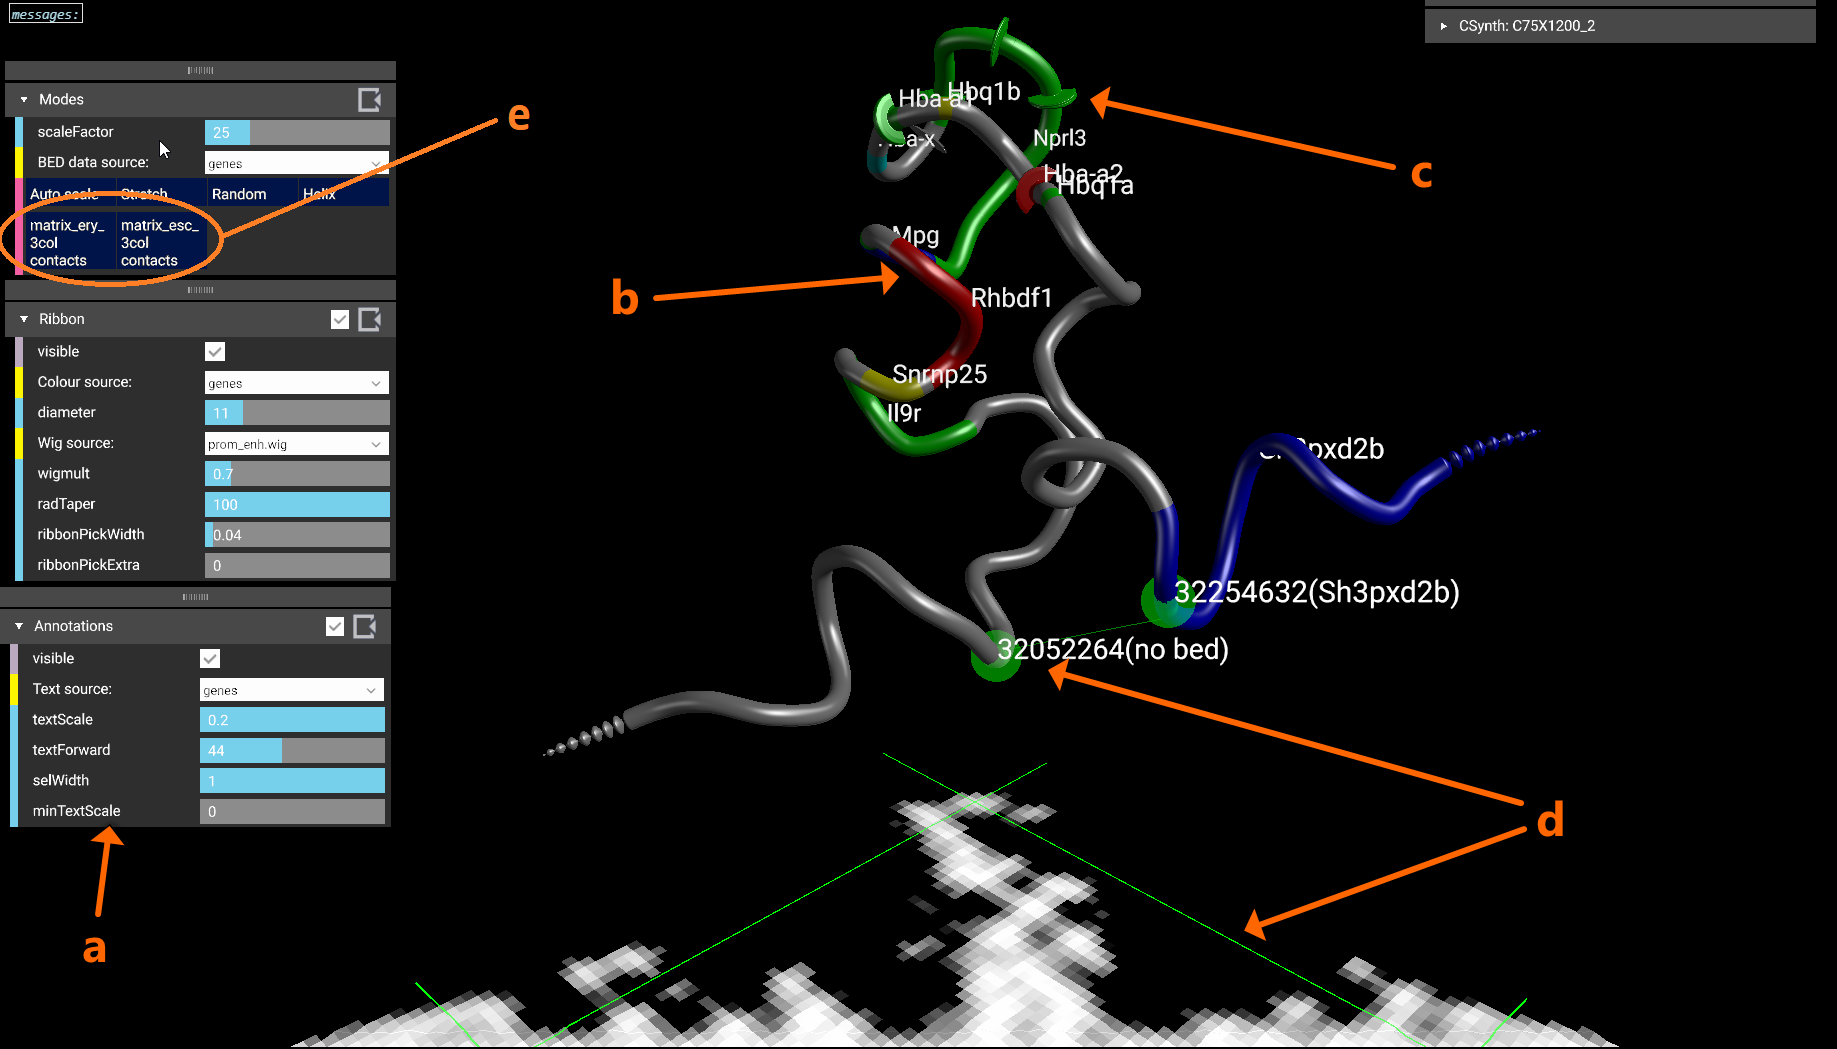
The figure above is a screenshot of CSynth with the two models loaded. (a) shows the menus that can be used to interact with the visualisation. (b) shows genes uploaded as BED format file for the region. Multiple BED files may be uploaded and switched between using the menu under the Modes or Annotations sections. (c) Visualisation of H3k4me1 data that has been uploaded in WIG format, is show as a widening of the diameter of the ribbon or chromatin backbone. The diameter of the ribbon may be adjusted interactively using the wigmult parameter in the Ribbon section of the menus. Similar to BED files multiple WIG format files may be uploaded and selected to view. (d) Using the mouse or VR pointer clicking any part of the heatmap shows a green intersecting line that represents the point selected and the position is also shown as a corresponding point on the 3D model. This is useful when investigating patterns seen in the heatmap and their corresponding structures. (e) Shows the buttons that are generated when you upload more than one model. In this example two models have been uploaded allowing you to switch between the erythroid and embryonic stem cell models by selecting “erythroid cell IF” and “ES cell IF” respectively.
View Example 1 »
Files used in this dataset can be downloaded at, example1.zip
Example 2. Yeast, demonstration dataset (Crick model):
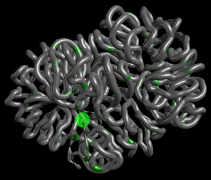
These data, derived from a study in fission yeast (S. pombe), shows conformational changes on the right arm of chromosome II during mitosis and interphase as well as the patterns of condensin binding sites. The data was modelled at the Crick Institute and is published in Nature Genetics (Kakui et al, 2017), and available at GEO (acc. GSE94478)
The data is from a high resolution experiment and may run slowly on some computers if they have integrated graphics card, rather than a discrete graphics card.
View Example 2 »
Files used in this dataset can be downloaded at, example2.zip
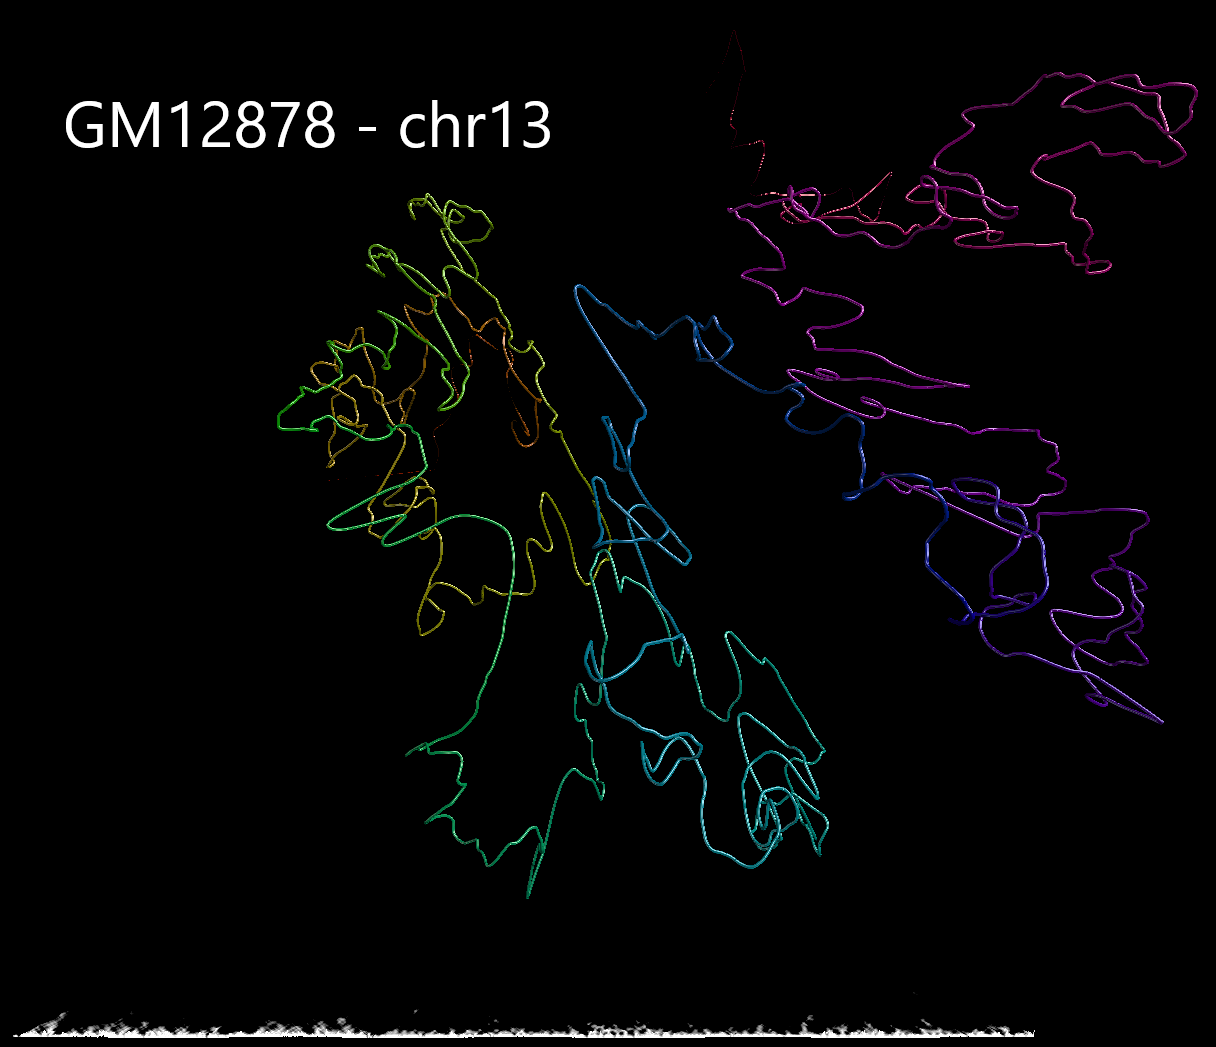
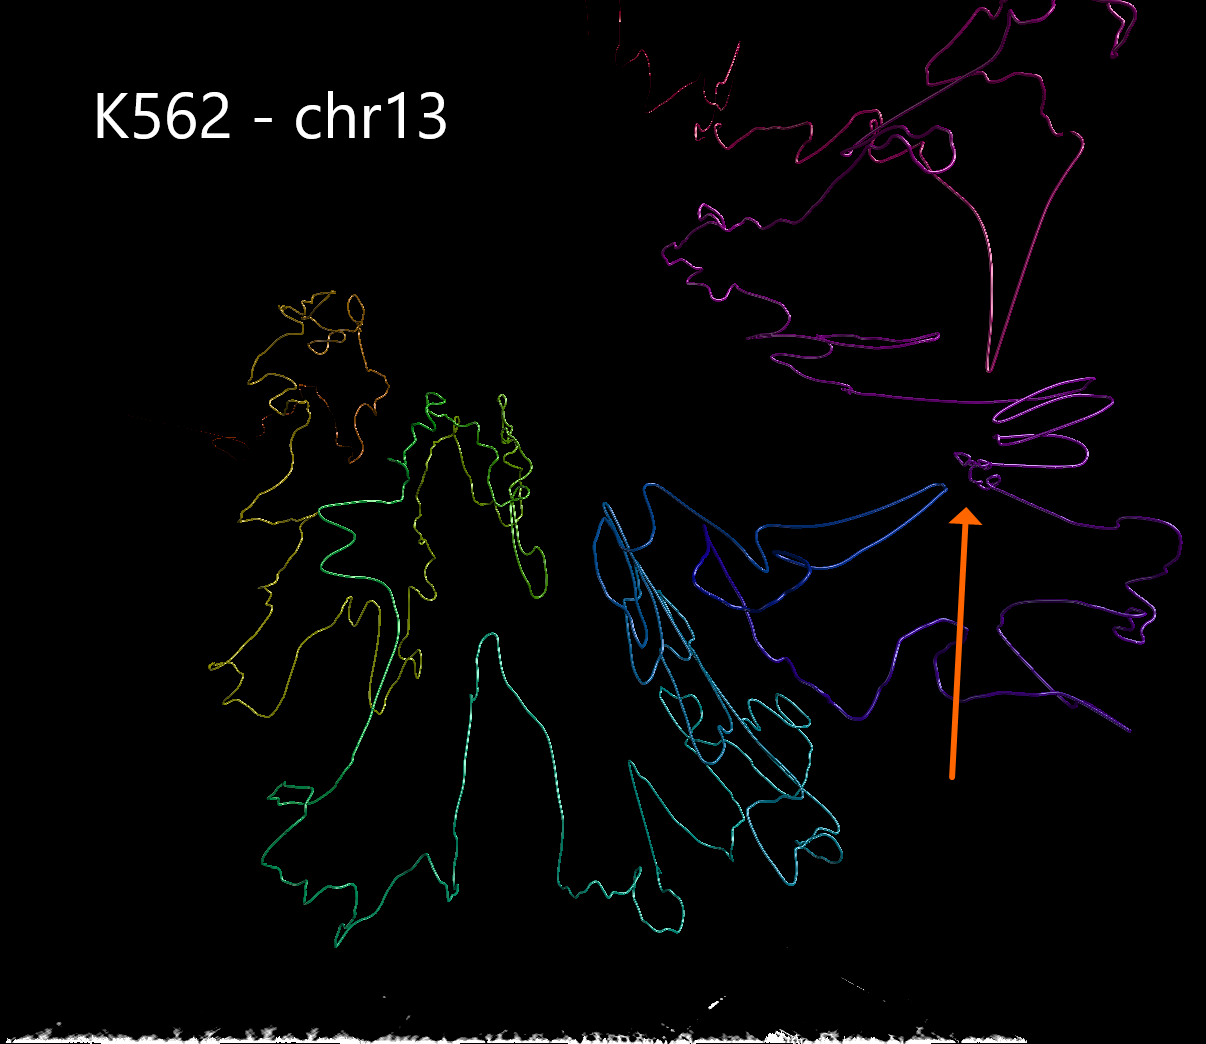
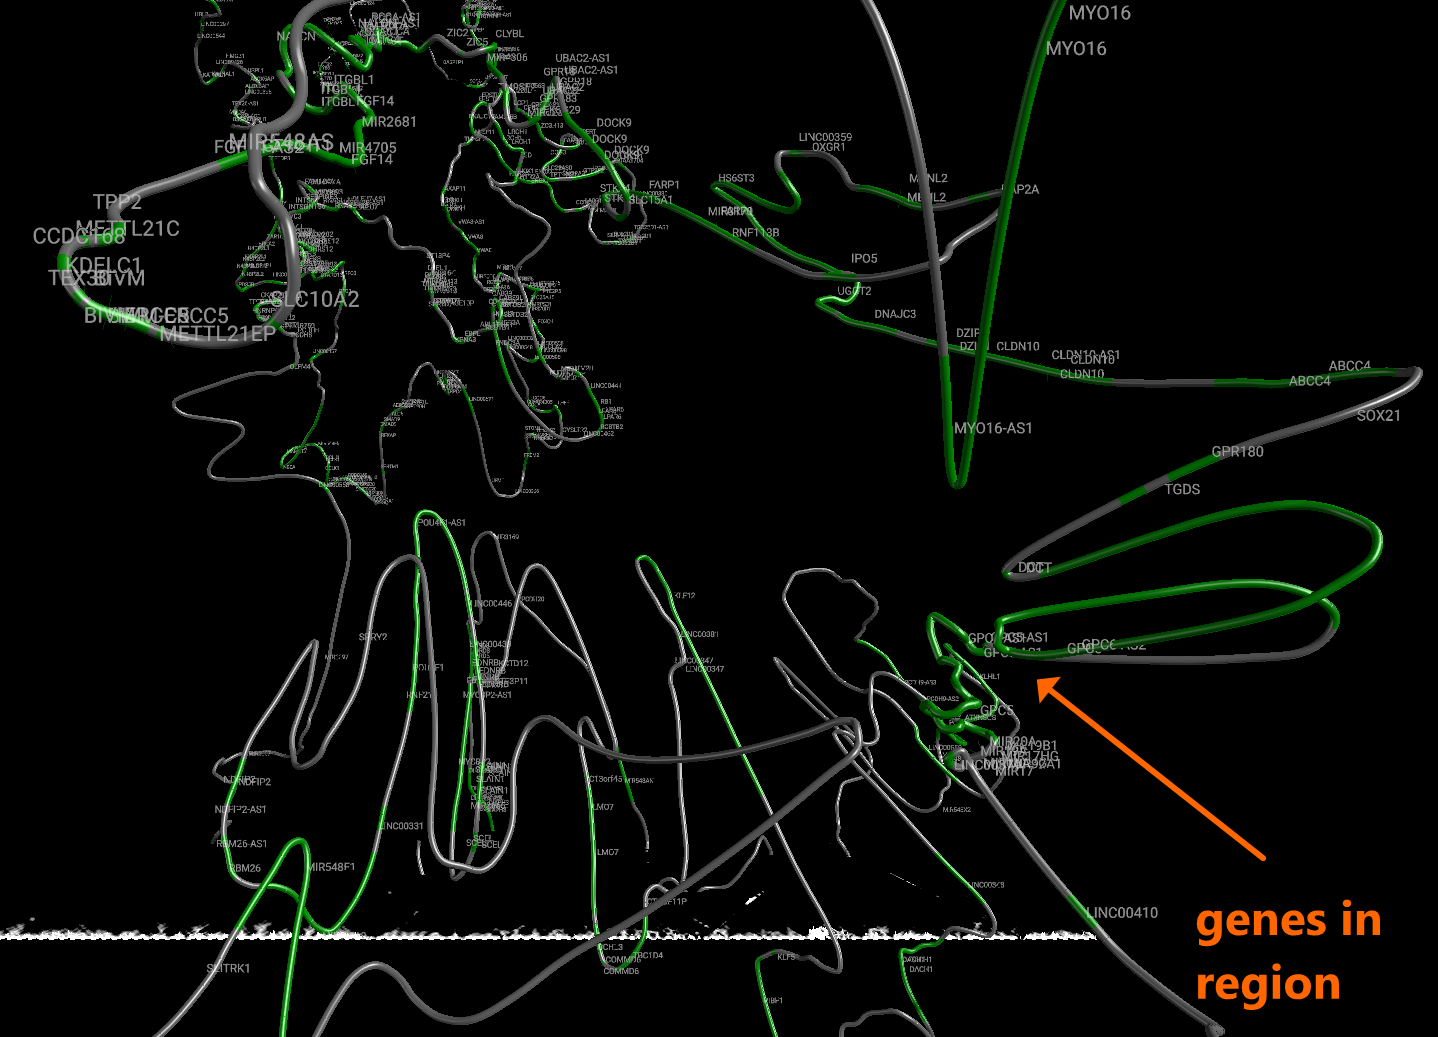
Example 3. Human structural variant on chromosome 13 in K562 cells compared with GM12878.
Using data from the Cell Paper (Rao et al. 2014) “A 3D Map of the Human Genome at Kilobase Resolution Reveals Principles of Chromatin Looping” a structural variant is clearly visible when comparing between the two cell types on chromosome 13. CSynth gives some insight in how such structural variants physically would change the structure of chromatin.
View Example 3 »
Files used in this dataset can be downloaded at, example3.zip
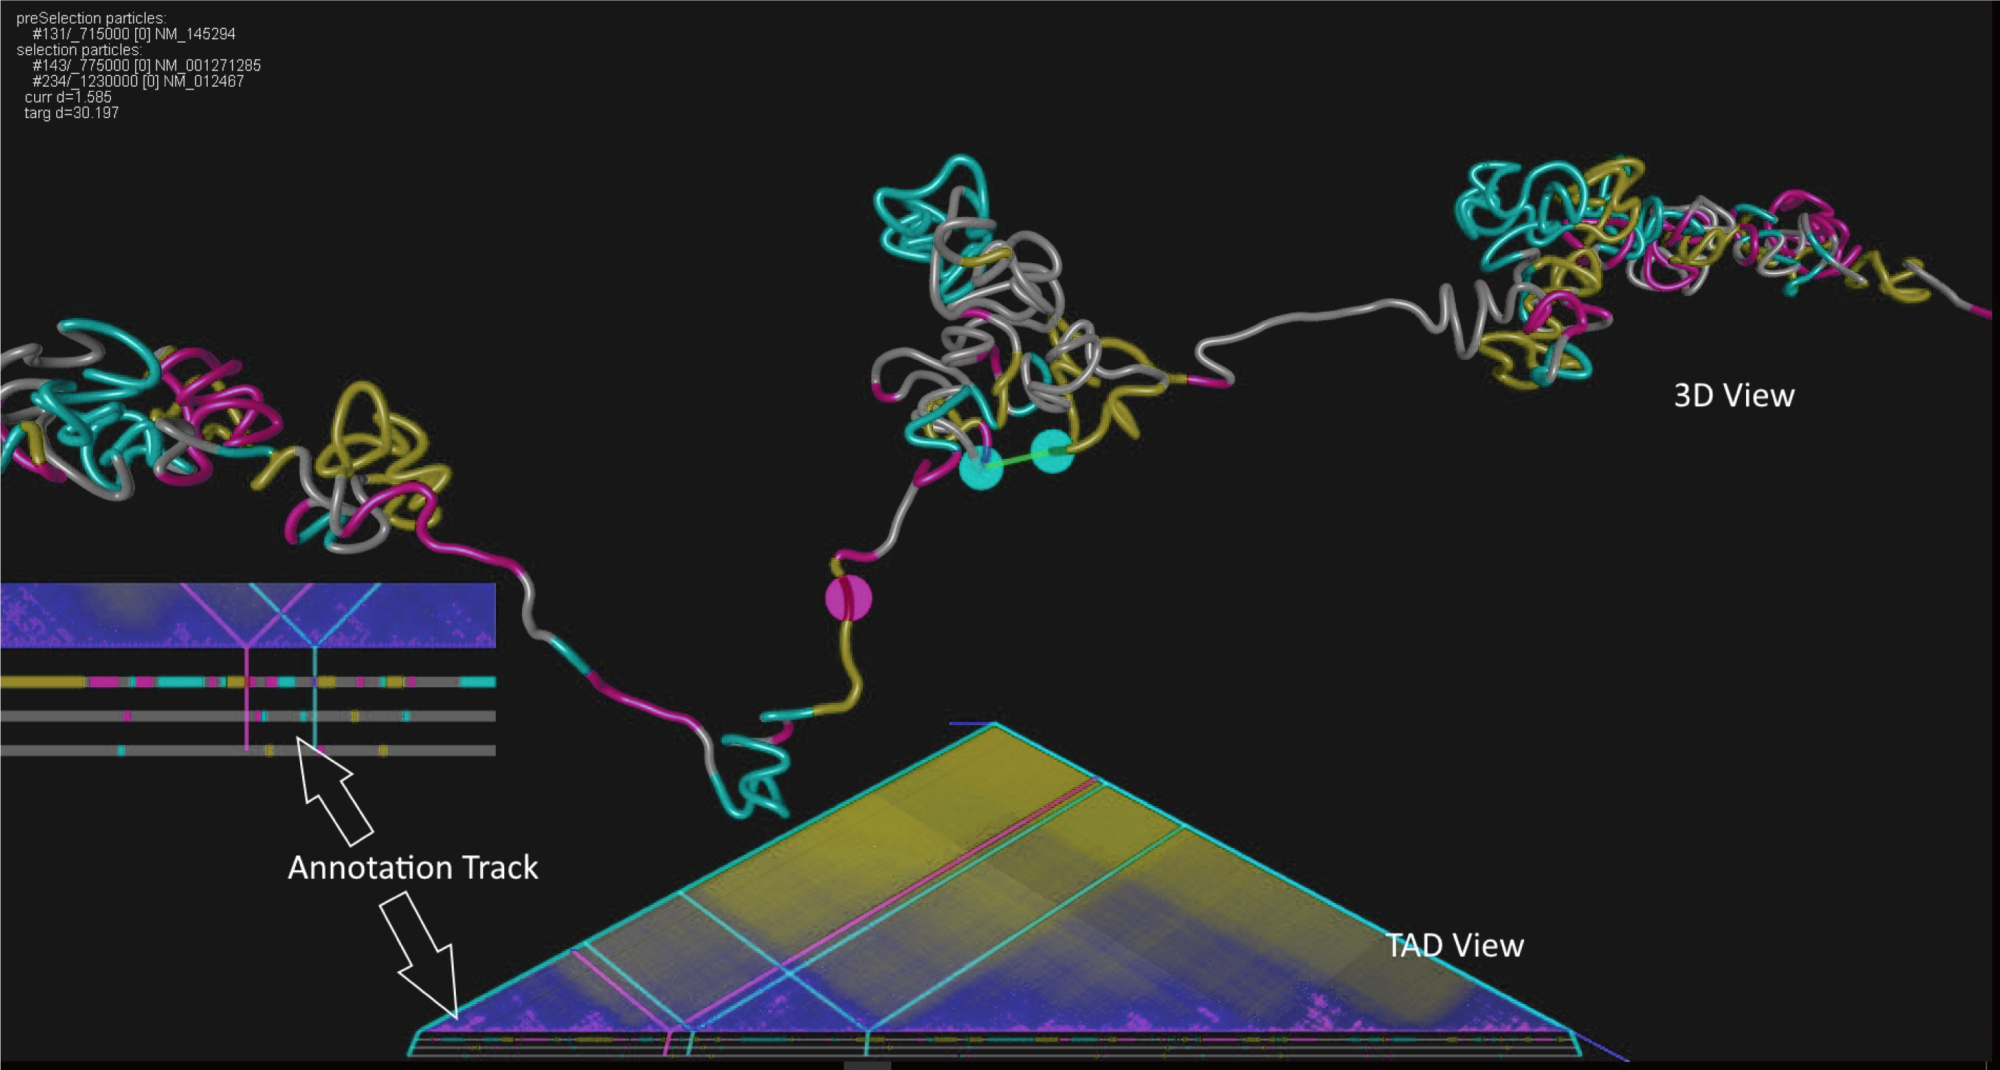
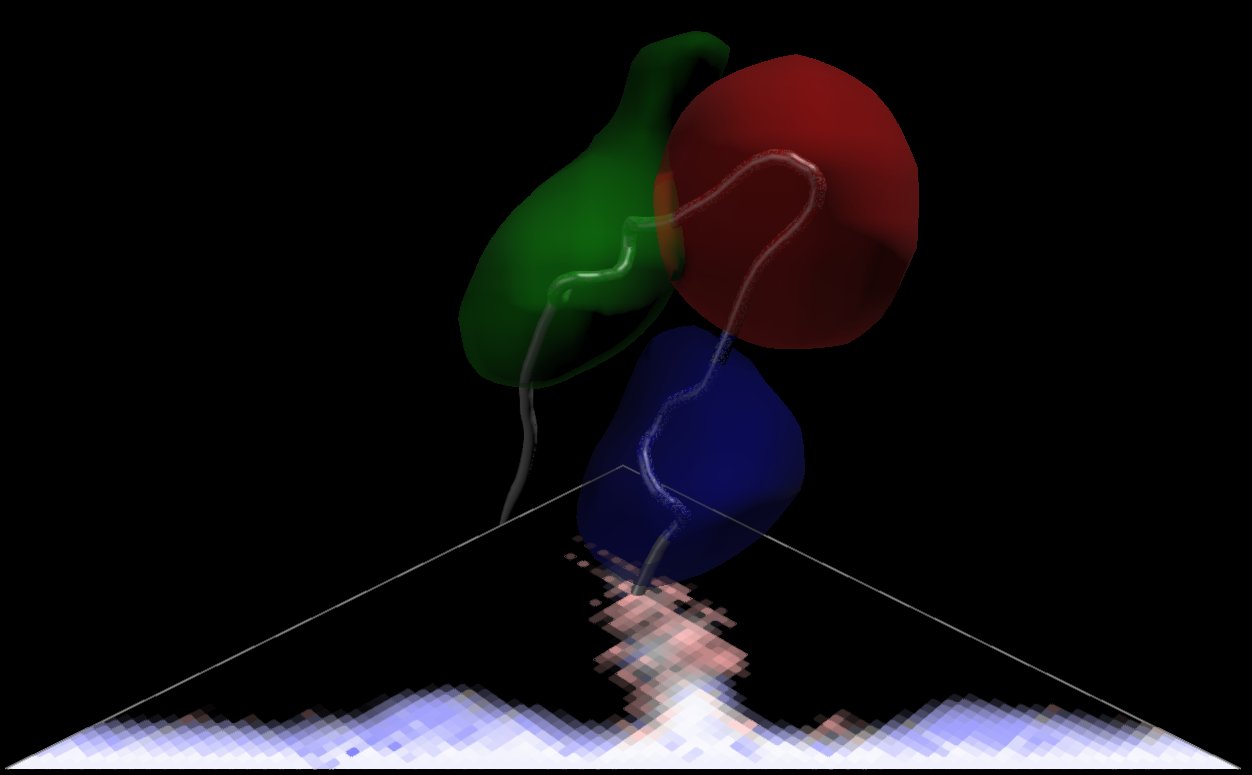
Example 4: Mouse alpha globin with microscope data
This is an extension of example 1, with lower resolution. This model additionally uses microscope data that captures three regions of the conformation. This data is displayed as an implicit surface, and is also used to complement the HiC data in the modelling to fit the conformation within the regions seen by the microscope.
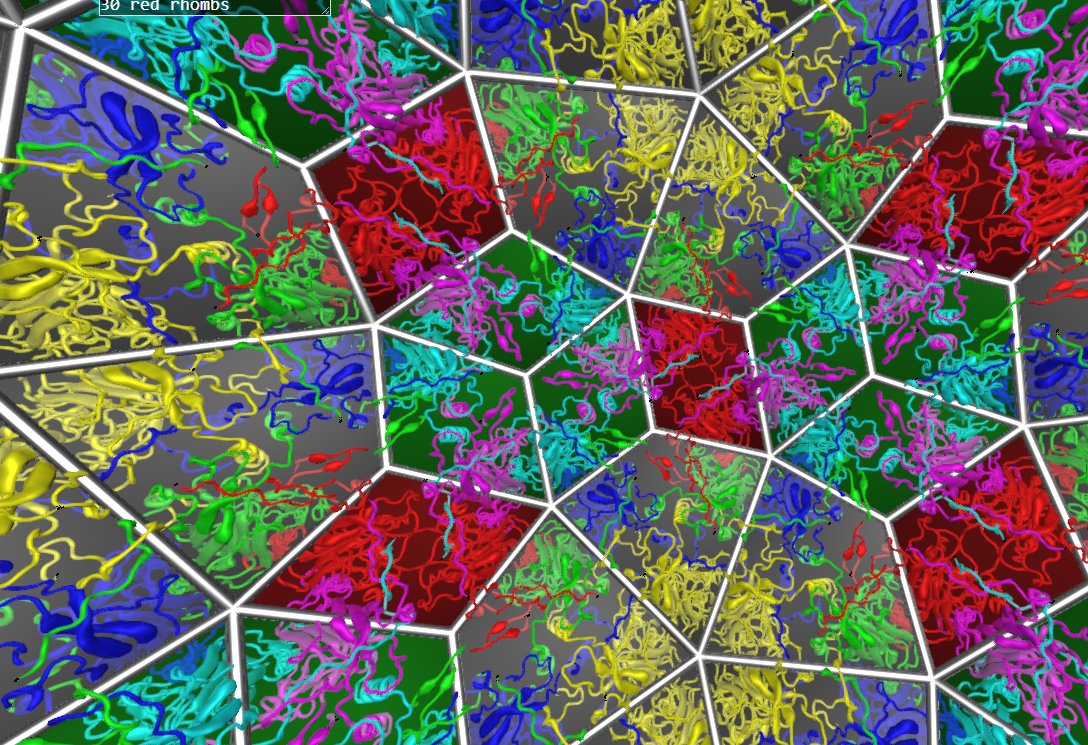
Example 5: Icosohedral Viruses
This work is in collaboration with Reidun Twarock and others at the Mathematics Department of York University. It has been exhibited various places, including at the Institute of Mathematics and it’s Applications, and the Lowry Gallery in Manchester.
It shows several 60-fold symmetric viruses with a standard 3d view and underlying mathematical structures. It is particularly effective in virtual reality.
This project relies on CSynth rendering, but does not use its modelling capabilities.