From Crystallography
101 --- An Introductory Course by Bernhard
Rupp
From Crystallography
101 --- An Introductory Course by Bernhard
Rupp
Publications in Computational Chemistry & Molecular Biology on Electron Density Mappings by :
BibTeX references.
Web links:
Nina Amenta, Sunghee Choi, Maria E. Jump, Ravi Krishna Kolluri, Thomas Wahl
University of Texas @ Austin, Computer Science Dept.,
Technical Report Number TR-02-27, October 2002
We consider a problem which is part of the process of determining the three-dimensional structure of a protein molecule using X-ray crystallography: given an estimated map of the electron density of the molecule as a function on three-dimensional space, we identify regions which are likely to belong to alpha-helices. Our approach is to compute a new kind of skeleton - the power shape - and then identify the helical substructures within the power shape with a variant of geometric hashing.
Jonathan Greer
Methods
in Enzymology, vol. 115,
Diffraction Methods for Biological Macromolecules, Part B,
pp. 206-224, November 1985.
Automated methods are described for improved interpretation of protein electron density maps by using basic pattern recognition and other advances in computer science and artificial intelligence. Prepn. of the electron density map, its skeletonization, tracing of the chain, isolation of the central mol., and other features of the method are described, as well as applications to RNase S, Bence-Jones Rhe, and future directions.
Jonathan Greer
Journal of Molecular Biology, vol. 82, pp.279-301, 1974.
Acta Crystallographica, D58(12), pp. 2043-2054, 2002.
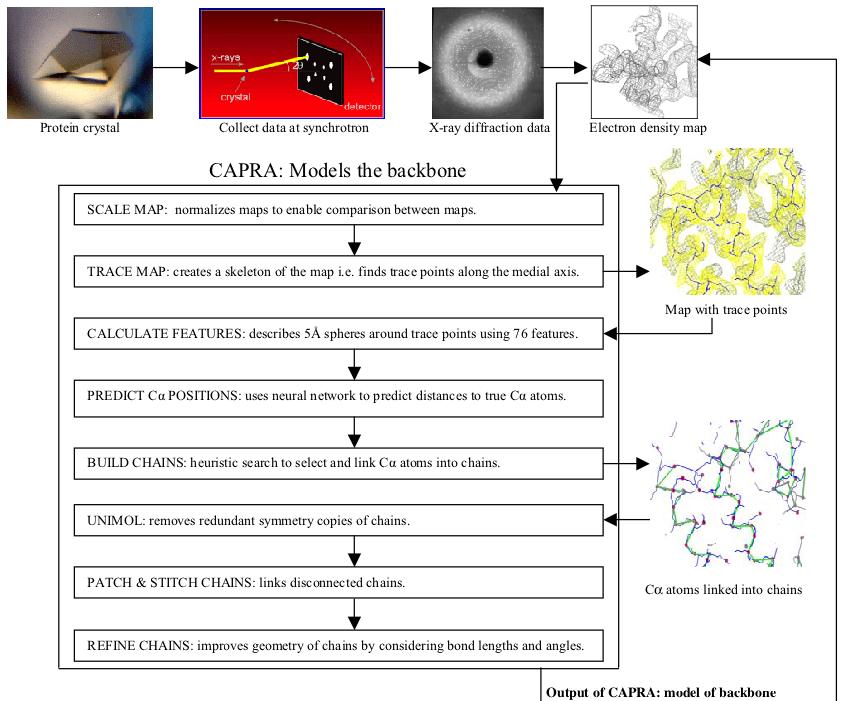
Most crystallographers today solve protein structures by first building as much of the protein backbone as possible and then modeling the side chains. Automating the determination of backbone coordinates by computer-based interpretation of the electron density would enhance the speed and possibly improve the accuracy of the structure-solution process. In this paper, a new computational procedure called CAPRA is described that predicts coordinates of C-alpha atoms in density maps and outputs chains of C-alpha atoms representing the backbone of the protein. The result constitutes a significant step beyond tracing the density, because there is ideally a one-to-one correspondence between atoms predicted in the chains output by CAPRA and C-alpha atoms in the true structure (refined model). CAPRA is based on pattern-recognition techniques, including extraction of rotation-invariant numeric features to represent patterns in the density and use of a neural network to predict which pseudo-atoms in the trace are closest to true C-alpha atoms. Experiments with several MAD and MIR electron-density maps of 2.4-2.8 Å resolution reveal that CAPRA is capable of building 90% of the backbone of a protein molecule, with an r.m.s. error for C-alpha coordinates of around 0.9 Å.
Keywords: CAPRA (C-Alpha Pattern Recognition Algorithm); electron-density maps; modelling of protein backbones; prediction of C-alpha atom coordinates.
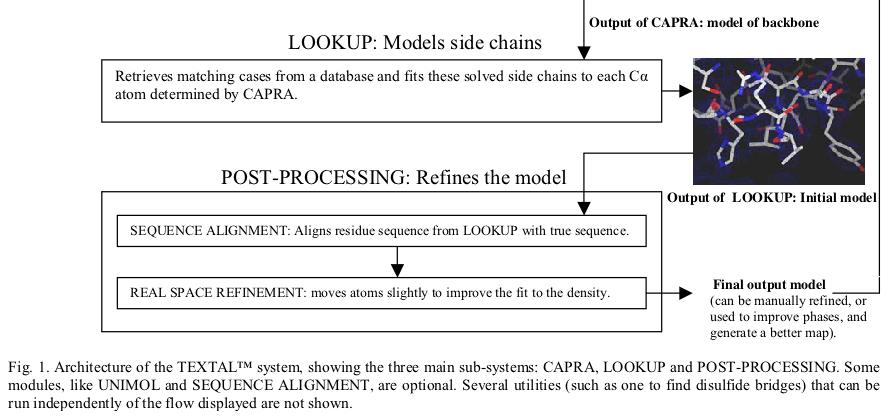
Holton T.R., Ioerger, T.R., Christopher, J.A. and Sacchettini, J.C.
Acta Crystallographica, D56(6), pp. 722-734, 2000.
TEXTAL is an automated system for building protein structures from electron-density maps. It uses pattern recognition to select regions in a database of previously determined structures that are similar to regions in a map of unknown structure. Rotation-invariant numerical values, called features, of the electron density are extracted from spherical regions in an unknown map and compared with features extracted around regions in maps generated from a database of known structures. Those regions in the database that match best provide the local coordinates of atoms and these are accumulated to form a model of the unknown structure. Similarity between the regions in the database and an uninterpreted region is determined firstly by evaluating the numerical difference in feature values and secondly by calculating the electron-density correlation coefficient for those regions with similar feature values. TEXTAL has been successful at building protein structures for a wide range of test electron-density maps and can automatically model entire protein structures in a few hours on a workstation. Models built by TEXTAL from test electron-density maps of known protein structures were accurate to within 0.6-0.7 Å root-mean-square deviation, assuming prior knowledge of C positions. The system represents a new approach to protein structure determination and has the potential to greatly reduce the time required to interpret electron-density maps in order to build accurate protein models.
Leherte, Laurence; Glasgow, Janice; Baxter, Kim; Steeg, Evan; and Fortier, Suzanne
Journal of Artificial Intelligence Research (JAIR), vol. 7, pages 125-159, 1997.
A fundamental goal of research in molecular biology is to understand
protein structure. Protein crystallography is currently the most
successful method for determining the three-dimensional (3D)
conformation of a protein, yet it remains labor intensive and relies on
an expert's ability to derive and evaluate a protein scene model. In
this paper, the problem of protein structure determination is
formulated as an exercise in scene analysis. A computational
methodology is presented in which a 3D image of a protein is segmented
into a graph of critical points. Bayesian and certainty factor
approaches are described and used to analyze critical point graphs and
identify meaningful substructures, such as alpha-helices and
beta-sheets. Results of applying the methodologies to protein images at
low and medium resolution are reported. The research is related to
approaches to representation, segmentation and classification in
vision, as well as to top-down approaches to protein structure
prediction.
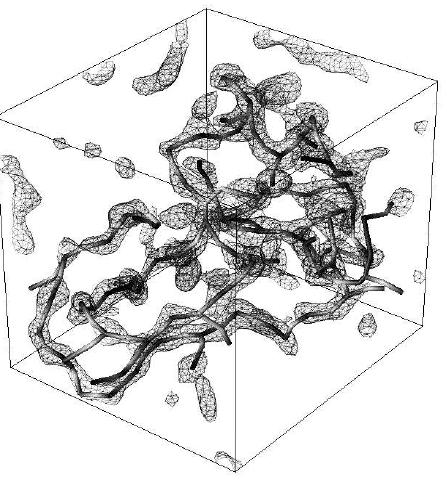
Fig.7: 3D contour and Critical Point Graph (CPG) for a unit cell of
protein 4PT1 (58 residues)
constructed at 3 Angstrom resolution. The CPG was generated using the
output of the
ORCRIT program (the Oak Ridge CRITical point
network program).
Notes
from Jim Davies
This paper describes techniques for segmenting proteins and identifying secondary structure. [127]
Molecular scene analysis: the processes of reconstruction, classification and understanding of molecular images. [125] It uses rules of biochemistry and structural templates to interpreting images from crystallization experiments. A protein crystal is a substance in which the protein regularly repeats. Any one repeating cubic section of the crystal is termed a "unit cell." [126] A unit cell is used to create an "electron density map," (EDM)which is "a 3d array of real values that estimate the electron density at given locations in the unit cell." That is, where there are a lot of electrons means there are atoms. So the rough shape of the molecules in the unit cell can be seen in the EDM. These EDMs are noisy because of the phase problem. Interpretation of EDMs involves a biologist segmenting the image into features, and then compared with anticipated structural motifs. These guesses result in information that allows the EDM to be more refined. It takes forever and requires an expert, who must recognize motifs in the 3d representation. The eventual goal of the research this paper describes it to automate this process.
Ideally, we would be able to predict global structure from the amino acid sequence, which is relatively easy to get. Because this is a difficult and unsolved problem, x-ray crystallography and nuclear magnetic resonance are the only realistic ways to do it.[128]
The 3d annotated graph
The simple representation this work uses preserves relevant shape,
connectivity, and distance information, in 3d annotated graphs, which
trace the main and side chains of the protein (protein is made of a
chain of amino acids, the main chain, and connected side chains.) The
graph nodes are amino acid residues and the edges are bond
interactions.
This graph can be used to determine secondary structure motifs in the
protein (secondary structures are alpha helices and beta sheets. Most
proteins are made of these structures and "loops," which connect
them.
Section 2 of this paper describes the basic molecular biology of proteins, which I will not summarize.
Much of vision research involves constructing a 3d model from 2d images. In contrast crystallographic data is already in 3d voxels, it's noisy and incomplete, but shadows, shading, and occlusion are not problems. [130]
From the initial low-rez EDM, the first goal is to locate where the
protein is and distinguish it from water (the "solvent").[131]
From the medium-rez EDM, the goal is to identify amino acid (residues)
and the secondary structures (alpha helices and beta sheets). At
high-rez you want to identify specific residues and perhaps the
locations of individual atoms.
The first step of scene analysis is to partition the image into regions, where each region hopefully corresponds to some meaningful part. These parts are used as input for a classifier. Critical points define a skeleton (but not by thinning). The protein data bank (PDB) is a database of protein structures which is the data for pattern recognition. Substructures repeat in protein shapes.
This paper will argue for the feasibility of topological approaches to low and medium rez EDMs.[133]
There are peaks and passes along the chain of amino acids in the EDM. The peaks are generally associated with amino acid residues and and passes are bonds that link them.[137] Where there is ambiguity, there are plans to have the system evaluate hypotheses.
That at low resolution, linear sequences of critical points are secondary structures.
SYSTEM: ORCRIT
The peaks and passes at 5 angstroms have a hierarchical relationship with the more detailed peaks and passes at 3 angstroms.[140]
Statistics were used to analyze 63 protein structures. f(ssm|g) is the probability distribution where ssm is the secondary structure motif and g is the geometrical constraints. These were computed for alpha helix, beta sheets, and turns (loops).[142]
Both a Bayesian/Minimum Message Length (MML) approach and a MYCIN-like approach were used to try to identify secondary structure in ideal data. The first Bayes method and the MYCIN approach traded off on quality depending on whether an alpha helix, beta strand, or turn was being identified.[148] The second Bayes approach had a lot of false positives. [149]
The experiment was run with experimental data as well, using a post-processed version of the ORCRIT output. No method was much better than any other. All were "relatively sucessful" at identifying secondary structures.
Acta Crystallographica, D50, pp. 155-166, 1994.
Methods to assist in the spatial and visual analysis
of electron-density maps have been investigated as part of a project in
molecular scene analysis [Fortier, Castleden, Glasgow, Conklin,
Walmsley, Leherte & Allen (1993). Acta
Cryst. D49, 168-178].
In particular, the usefulness of the topological approach for the
segmentation of medium-resolution (3 Å) maps of
proteins and their
interpretation in terms of structural motifs has been assessed. The
approach followed is that proposed by Johnson [Johnson (1977). ORCRIT. The Oak Ridge
Critical Point Network Program.
Chemistry Division, Oak Ridge National Laboratory, USA] which provides
a global representation of the electron-density distribution through
the location, identification and linkage of its critical points. In the
first part of the study, the topological approach was applied to
calculated maps of three proteins of small to medium size so as to
develop a methodology that could then be used for analyzing maps of
medium resolution. The methodology was then applied to both calculated
and experimental maps of penicillopepsin at 3 Å
resolution. The study
shows that the networks of critical points can provide a useful
segmentation of the maps, tracing the protein main chains and capturing
their conformation. In addition, these networks can be parsed in terms
of secondary-structure motifs, through a geometrical analysis of the
critical points. The procedure adopted for secondary-structure
recognition, which was phrased in terms of geometry-based rules,
provides a basis for a further automated implementation of a more
complete set of recognition operations through the use of
artificial-intelligence techniques.
Hongzhi Li
Master of Science's thesis, Dept. of Computing & Information Science
Queen's University, Kingston, OT, Canada, October 2002.
Prof. Janice Glasgow's Molecular Scene Analysis Laboratory.
Web link: http://www.ace.uwaterloo.ca/~liho/thesis/protein.html
Two approaches are commonly used to build protein backbone models for protein crystallography: the skeletonization approach and the topological approach. Among the algorithms implementing skeletonization, Greer's algorithm is a popular one. From our testing, however, some problems exist in Greer's algorithm. This thesis addresses two of the problems and provides methods to improve the performance of Greer's algorithm.
One problem in the implementation of Greer's algorithm is the limitation of the thinning algorithm it used: Hilditch's thinning algorithm. The thinning method cannot thin a thick shape well. We developed two methods to address the problem: density-reuse and multiple-loop algorithms. Both methods can effectively eliminate the voxel clusters in the skeleton.
The other improvement of Greer's algorithm is to adopt some methods from the topological approach to improve the chain correctness. We convert the skeleton grid from Greer's algorithm to a skeleton graph. The skeleton graph is then used as the input of the FORR cognitive architecture, which is from the topological approach. Usually the backbone is among the most repeatable paths from the evaluation system in the topological approach. From our testing, this integrated method can improve the chain correctness significiantly (up to 99%).
![[bold sigma]](http://scripts.iucr.org/logos/entities/sigma_bdgif.gif) (I)
< 2.0 for minimum resolution 2.5 Å]. In such cases,
a set of manual
and semi-manual model-building molecular-graphics tools is needed. At
the same time, converting the knowledge encapsulated in a molecular
structure into understanding is dependent upon visualization tools,
which must be able to communicate that understanding to others by means
of both static and dynamic representations. CCP4mg is a program designed to meet these needs
in a way that is closely integrated with the ongoing development of CCP4
as a program suite suitable for both low- and high-intervention
computational structural biology. As well as providing a carefully
designed user interface to advanced algorithms of model building and
analysis, CCP4mg
is intended to present a graphical toolkit to developers of novel
algorithms in these fields.
(I)
< 2.0 for minimum resolution 2.5 Å]. In such cases,
a set of manual
and semi-manual model-building molecular-graphics tools is needed. At
the same time, converting the knowledge encapsulated in a molecular
structure into understanding is dependent upon visualization tools,
which must be able to communicate that understanding to others by means
of both static and dynamic representations. CCP4mg is a program designed to meet these needs
in a way that is closely integrated with the ongoing development of CCP4
as a program suite suitable for both low- and high-intervention
computational structural biology. As well as providing a carefully
designed user interface to advanced algorithms of model building and
analysis, CCP4mg
is intended to present a graphical toolkit to developers of novel
algorithms in these fields.
Stanley M. Swanson
Acta Crystallographica Section D
Biological Crystallography
Volume 50, Part 5 (September 1994), pp. 695-708.
Paths of high density are traced by (3D) lines (ridges) connecting peaks to passes. Picture complexity approximates that of alpha-carbon models.